How To Measure Athleticism? 11 Ways to Measure Athleticism and Track Your Progress
Looking lean and moving like an athlete are two different outcomes. Here are 11 tests that measure what the mirror never will: speed, power, strength, agility, and endurance.
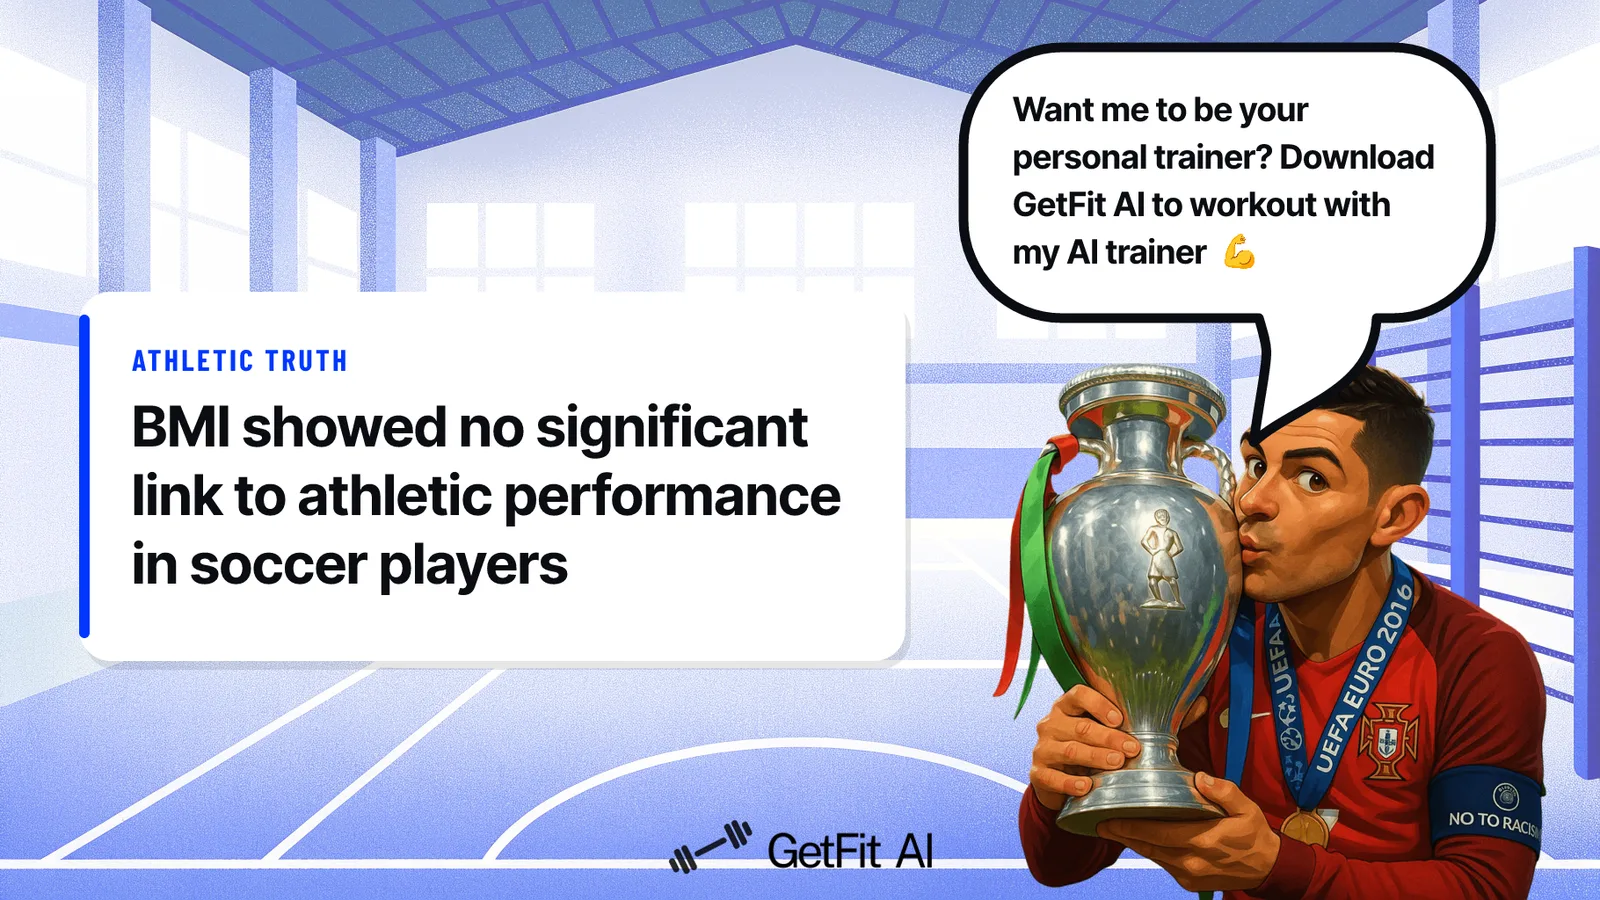
Athletic progress is something you feel over time, or so the assumption goes. If you keep showing up and working hard, you’ll notice when you’ve improved. But a 2023 University of Alabama study found that BMI showed no significant correlation with field-based athletic performance metrics in youth soccer players, directly contradicting the assumption that a simple body-composition number predicts athleticism.
Scale weight and mirror reflection are cosmetic outputs. They capture mass distribution, not power output, not reactive agility, not the speed at which your nervous system fires under pressure. See our AI fitness app for how this works in practice.
Looking lean and performing like an athlete are two completely different outcomes. Most people treat them as the same signal. Someone who drops 10 pounds but stalls on the same pull-up count for six months looks different but performs identically. The mirror gave them a passing grade their body had not earned.
Athleticism covers multiple distinct qualities. Speed, agility, and power each capture distinct physical qualities, and a person can score well on one dimension and poorly on three others. That describes most recreational gym-goers. Athletes built for power carry higher fat percentages by design, while gymnasts and distance runners require entirely different compositions, so no single number can summarize a multi-axis physical system. Before you run any of the 11 assessments ahead, you need to understand what athletic ability is actually made of, because missing even one component will quietly cap every other gain you make.
Key takeaways
- BMI and mirror checks have zero meaningful correlation with athletic performance, a 2023 University of Alabama study found no significant link between BMI and field-based athletic metrics in youth soccer players.
- The tests that actually reveal athleticism, 40-yard dash, vertical jump, broad jump, Pro Agility Shuttle, 1RM squat, take roughly 20 minutes and require no specialized equipment or a gym membership.
- Relative strength exposes what raw load hides: a lifter who adds 20 lbs to their squat while gaining 20 lbs of bodyweight has made zero athletic progress, even though the number went up.
- Agility and change-of-direction scores routinely expose a gap that pure strength training misses entirely, you can squat twice your bodyweight and still look lost on a cut.
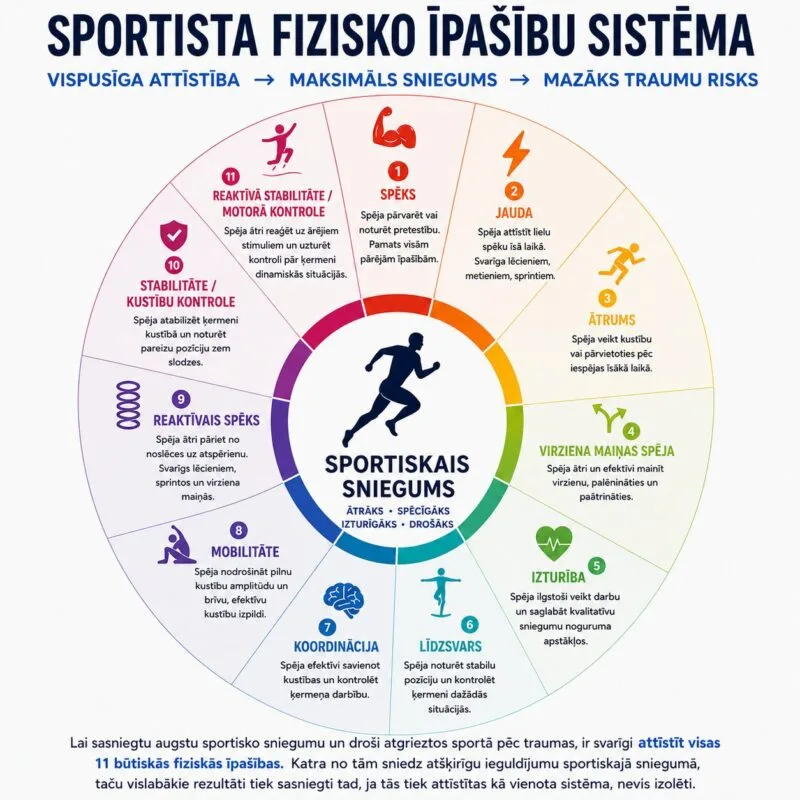
- VO2 max, measured through a simple 1.5-mile run, determines whether your speed and power numbers hold up through a full session or collapse halfway through, it's not a bonus metric, it's a ceiling.
- Test scores without a retest cadence are just data points in a notes app, a 4-to-6-week structured retest cycle is what turns a snapshot into a trend you can actually train from.
- GetFit AI's Progress analytics closes that loop: weight logging and body-weight trend charts track relative strength shifts over time, while the workout analytics dashboard surfaces whether your numbers are moving in the right direction between test days.
What Identifying Athletic Ability Actually Requires Before You Test Anything
The common assumption is that athletic progress is something you feel over time, if you keep showing up and working hard, you’ll notice when you’ve improved.
Pros and cons at a glance
| ✓ Pros | ✗ Cons |
|---|---|
| Works in a parking lot or gym with tape measure and stopwatch | Self-timing with a phone introduces 0.1 to 0.3 seconds of error |
| Measures maximum acceleration and linear running speed | Landing balance affects the broad jump score |
| Links vertical jump directly to fast-twitch fiber recruitment | Without structured tracking, data dies on the page |
| Broad jump captures horizontal power missed by vertical test | N/A |
| Each score becomes a specific training signal | N/A |
The Five Physical Traits That Actually Define Athletic Potential
-
Speed
-
Power
-
Strength
-
Agility
-
Endurance
These five qualities are distinct, and each fails independently of the others. A runner with elite aerobic capacity can still move slowly off the mark. A powerlifter with a 500-pound squat can lack the reactive coordination to cut laterally at pace. That separation matters, because a weakness in one trait will not be masked by strength in another. The NFL Combine uses a six-test battery precisely because no single drill captures the full picture.
The Age Window That Makes Baseline Testing Urgent Right Now
Each of these traits follows its own aging curve. For sprints, jumps, and throws, men peak around age 25, while peak strength arrives at roughly the same point before plateauing between 35 and 40 and then declining by 25 percent by age 65. Marathoners peak at 30 for men, and endurance-heavy events like Ironman push that ceiling to 32.
If you are 25 to 30 right now, you are sitting at or near your biological ceiling for most athletic qualities, so this is the most valuable moment to establish a baseline.
Key takeaway: A baseline taken today is a reference point that every future training decision depends on.
Now that you know what a complete athletic profile must cover, the next question is where to start measuring, and for most coaches, the answer is always the same two qualities: speed and power.
Key Fitness Measurements for Speed and Power Every Athlete Should Know
Scouts watching NFL combine footage don’t care how a prospect looks in a t-shirt. They care about three numbers: the 40-yard dash, the vertical jump, and the broad jump. Those three tests show up in every serious athletic evaluation because they each isolate a distinct physical quality that no mirror check or bodyweight number can capture.
Here is the part most beginners miss: those same tests work just as well in a parking lot or a gym with a tape measure and a stopwatch. You do not need a combine invite. You need about 20 minutes and the willingness to actually run the numbers. Access to elite biomechanical assessments, the kind that measure real speed and power outputs like sprints, jumps, and change-of-direction tests, has historically been limited to pro athletes with large budgets, leaving everyday athletes without actionable data.
1. 40-Yard Dash - The Gold Standard for Measuring Maximum Acceleration and Linear Speed
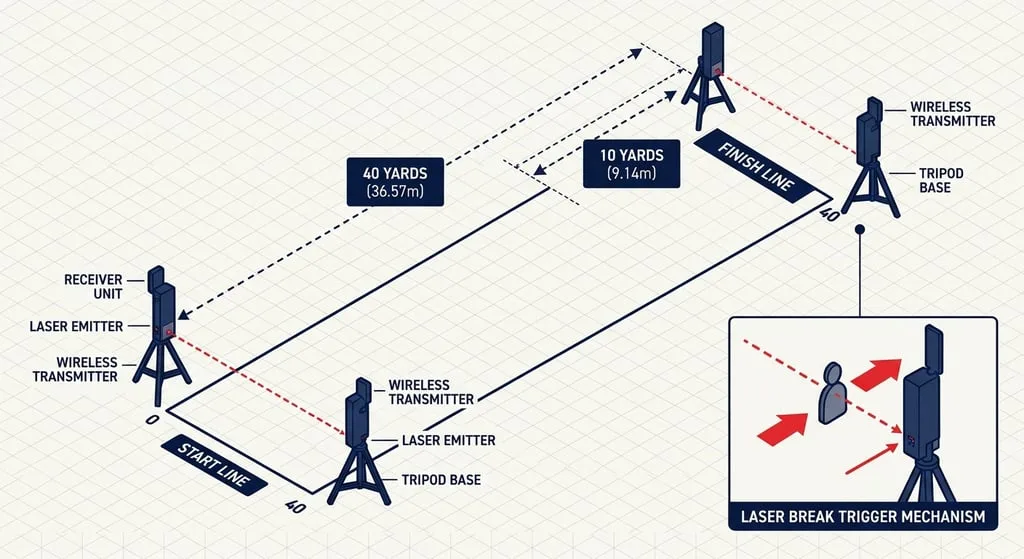
The 40-yard dash measures maximum acceleration and linear running speed, making it the most widely used sprint test in athletic evaluation. Mark 40 yards on flat ground, start from a two-point stance, and time yourself from first movement to the finish line. Untrained adults typically clock between 5.5 and 6.5 seconds, according to standard athletic testing norms. NFL skill-position players average closer to 4.4 to 4.6 seconds at the combine, which gives you a useful reference point for what elite linear speed actually looks like. The honest limitation here: self-timing with a phone introduces roughly 0.1 to 0.3 seconds of error, so recruit a friend to hold the stopwatch if accuracy matters to you.
2. Vertical Jump - The Definitive Test for Lower-Body Explosive Power
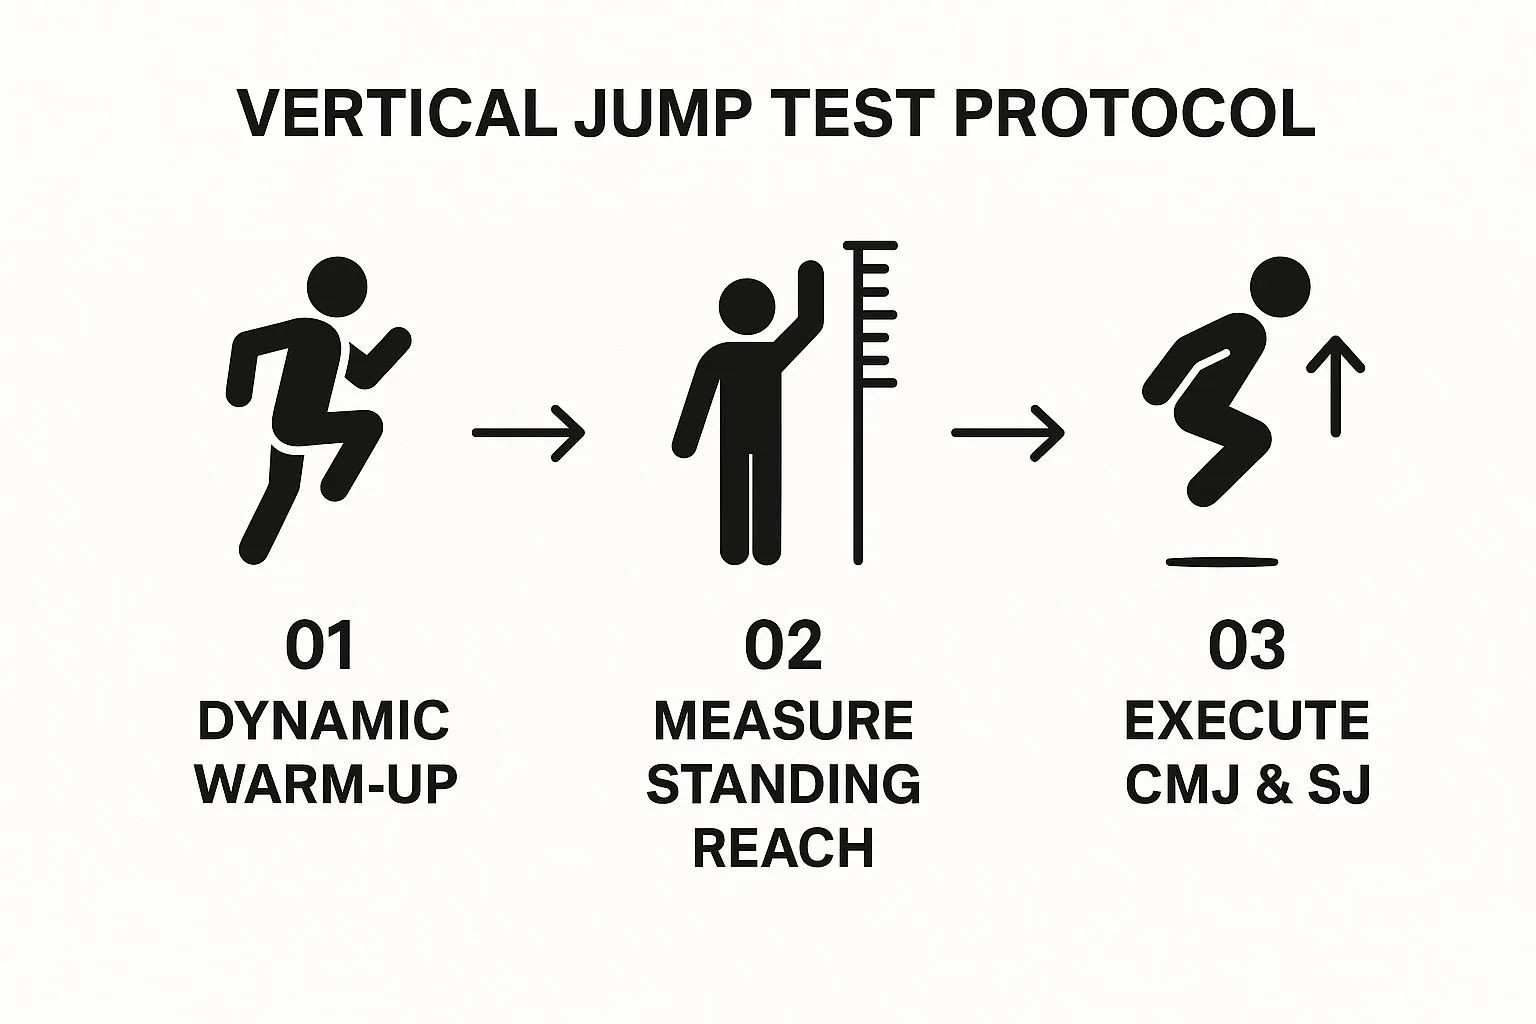
The vertical jump measures lower-body explosive power, specifically how much force your fast-twitch muscle fibers can generate in a single ground-contact moment. Stand next to a wall, reach up and mark your standing height with chalk, then jump as high as possible and mark your peak reach. The difference between the two marks is your vertical. Research published by the National Strength and Conditioning Association links vertical jump performance directly to fast-twitch fiber recruitment, which is why it appears in virtually every power-athlete assessment.
Untrained adults typically land between 12 and 20 inches. The NBA draft combine average sits around 28 inches, which puts “athletic” in concrete terms. If you jump less than 12 inches, your training priority is plyometrics, not more steady-state cardio.
3. Standing Broad Jump - The Essential Benchmark for Horizontal Explosive Power and Force Production
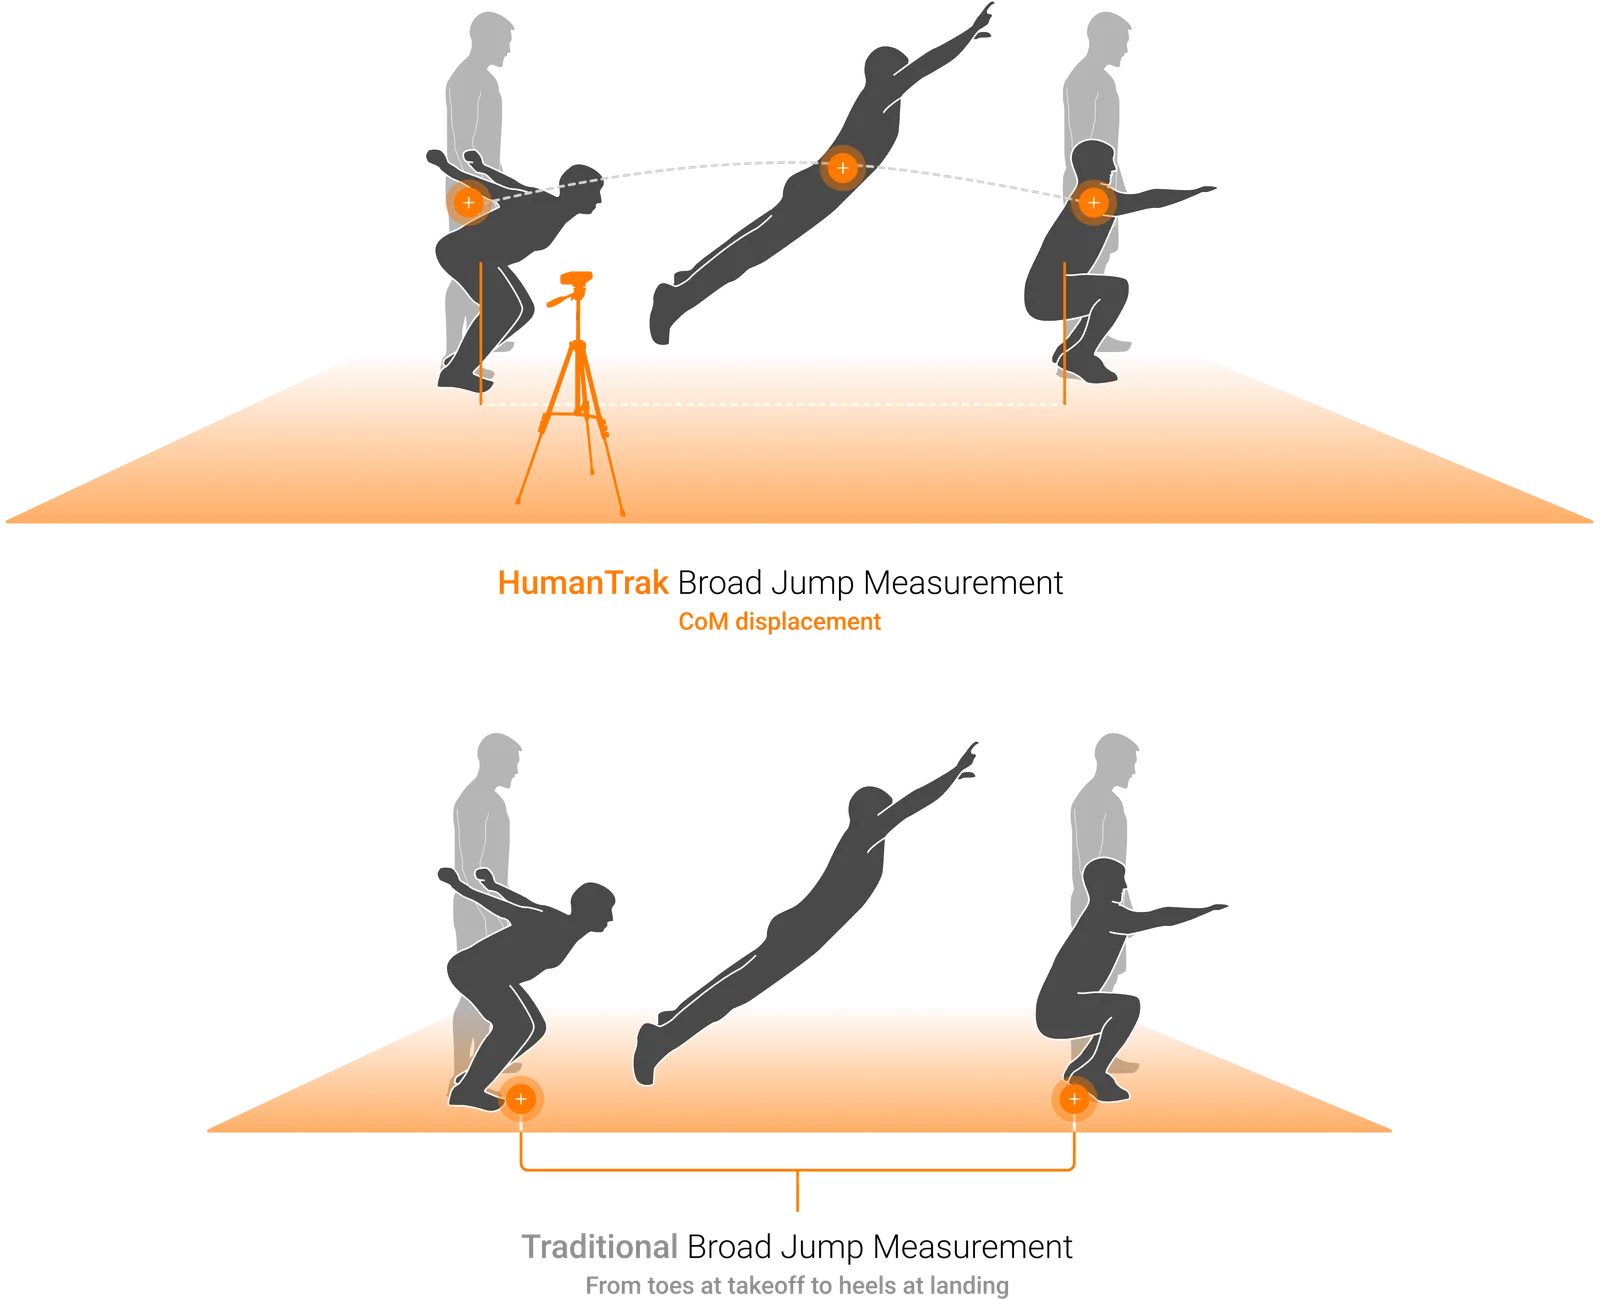
The standing broad jump measures horizontal explosive power and force production, capturing how effectively you project your bodyweight forward from a dead stop. Stand with feet shoulder-width apart at a tape measure’s zero mark, swing your arms, and jump as far forward as possible, landing on both feet. Measure from the zero mark to your nearest heel. Beginner norms sit around 5 to 6 feet for untrained adults, according to industry research on fitness testing reference data from Topend Sports.
The broad jump catches what the vertical misses: your ability to express power in a forward direction, which maps more directly to sport acceleration than a purely vertical test does. One real constraint is that landing balance affects the score, so practice the landing mechanics before treating your first attempt as your baseline.
Athletic performance is genuinely multi-dimensional, and that is exactly why these three tests belong together rather than in isolation. A strong vertical with a weak 40 time tells you something specific about your power-to-speed transfer. A wide gap between your broad jump and vertical suggests your horizontal force production is lagging. Each score becomes a training signal, not just a number to feel good or embarrassed about.
The common pattern among beginners is running these tests once, logging the number in a note somewhere, and never returning to it. The score stays a curiosity instead of becoming a feedback loop. This mirrors the deeper problem that has historically made elite speed-and-power development inaccessible: without structured tracking and programming built around your actual results, the data dies on the page.
GetFit AI’s Athlete-Style Custom Workout Plans are built from the first workout session around exactly this kind of output. Your scores drive the program, not a generic template. For athletes who have previously struggled with consistency due to lack of program structure, having a plan shaped by their own numbers, visible during each workout session and across the overall training program arc, is what finally keeps training moving past the first few weeks. The goal is simple: train the way the athletes you follow actually train, and that starts with treating your field-test results as the foundation of every programming decision, not an afterthought.
The social layer accelerates this further. GetFit AI’s friends, challenges, and leaderboards features are most powerful once you have connected with at least one friend in the app, ideally a workout partner who is also running these same field tests. Comparing 40-yard dash splits or broad jump distances inside a live leaderboard turns abstract data points into competitive feedback, which is the retention mechanism that keeps athletes training past week three rather than abandoning their baseline numbers in a forgotten note. If your goal is to train the way the athletes you follow actually train, that means treating every re-test as a data event, not a one-off curiosity, and having a structure that surfaces whether your programming is genuinely moving the needle on speed and power.
GetFit AI’s Premium plans make that structure accessible at whatever commitment level fits your timeline: a Premium Weekly Subscription at $1.99 per week if you want to test the system first, a Premium Monthly Subscription at $4.99 per month for sustained programming, or a Premium Yearly Subscription at $49.99 per year for athletes who are ready to commit to a full development cycle and track these benchmarks across multiple testing windows.
Speed and power off the line tell scouts a lot, but they only reveal half the athletic picture. The other half lives in how much force you can produce relative to your own bodyweight, which is exactly what the next section’s strength tests are designed to expose.
Related Reading
- Why Am I Not Getting Faster at Running
- Does Masturbation Affect Athletic Performance
- Biomechanics in Sports
- Why is Protein Important for Athletes
- What is Speed and Agility Training
- How to Be a Better Athlete
- How Does Sports Psychology Help Athletes
- Why is Hydration Important for Athletes
- Why Do Athletes Train at High Altitudes
- Why Do Athletes Stretch Before a Game?
- IV Therapy for Athletic Performance and Recovery
- Yoga and Athletic Performance
- Red Light Therapy for Athletic Performance
Strength and Power Measurement Tests That Reveal Your True Athletic Foundation
A 185 lb man who squats 185 lb and a 185 lb man who squats 275 lb are not the same athlete. Same bodyweight, same gym, completely different athletic foundation. That gap is what strength and power measurement actually captures, and it starts with two tests that most beginners skip entirely.
1. 1RM Back Squat Test - The Gold Standard for Lower-Body Absolute Strength
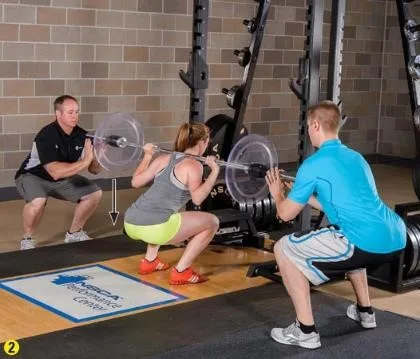
The 1-rep max (1RM) test is the standard protocol for quantifying absolute lower-body strength: load the bar progressively until you reach the maximum weight you can lift for one complete rep with sound form. Research published via Preprints.org confirms the 1RM is the gold-standard measure for absolute strength on compound lifts. The honest tradeoff: testing alone without a spotter carries real injury risk, so either use a power rack with safety pins or apply an estimated 1RM formula from a 3-5 rep set.
One reality worth naming directly: athletes dealing with ongoing injuries, knee soreness, post-surgical swelling, or structural limitations following something like ACL reconstruction are often unable to complete a full-load 1RM test at all. That gap in measurable data is a clinical constraint. A training plan that demands a max squat test on day one from an athlete who physically cannot perform it is a plan that athlete will fall behind on and quit.
Program structure has to bend to the person. GetFit AI’s Athlete-Style Custom Workout Plans are designed from the first workout session to account for what you can actually do today, building a structured training arc around your real starting point rather than an idealized one, so injury-limited athletes still generate a usable performance baseline instead of a blank profile.
2. Max Rep Pull-Up Test - Upper-Body Pulling Endurance With Zero Equipment
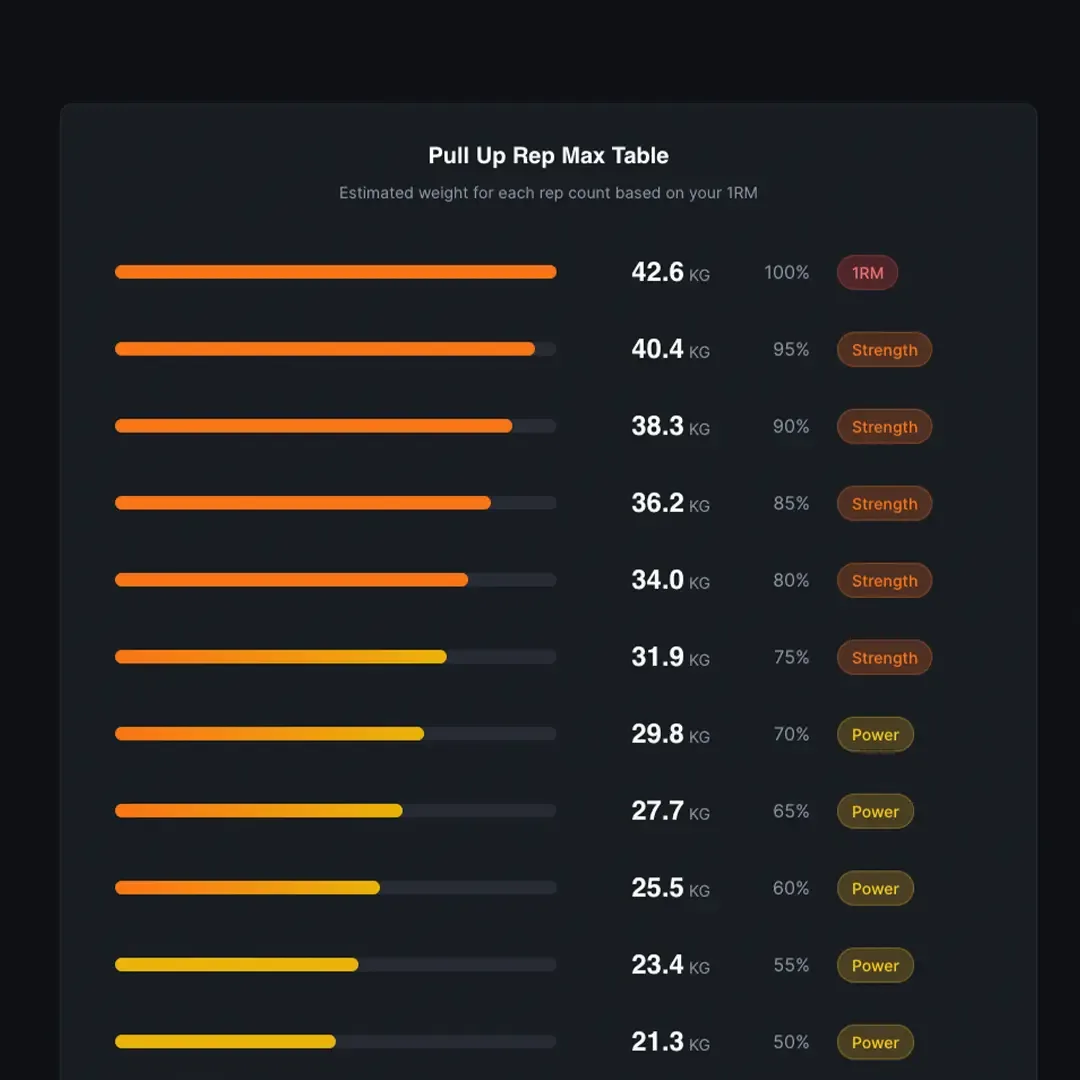
Max rep pull-ups performed to failure with strict form measure local muscular endurance, a distinct quality from absolute strength. The same Preprints.org manuscript classifies max-rep bodyweight tests as the practical standard for assessing this component of athleticism. The limitation heavier athletes consistently run into is real: every extra pound of bodyweight makes the test harder, so raw rep counts are not directly comparable across different body sizes without that context.
Relative Strength Ratio - Why Strength-to-Bodyweight Matters More Than Raw Numbers
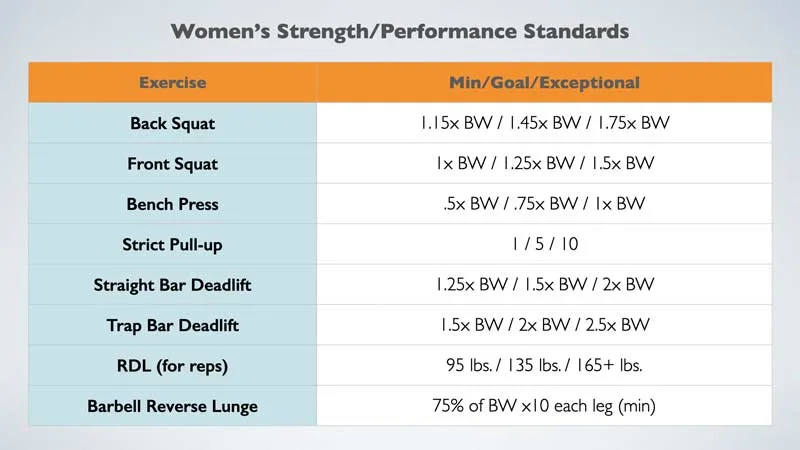
Relative strength is your 1RM divided by your bodyweight, and it is a more honest signal of athletic capacity than the raw number on the bar. Preprints.org research states directly that the strength-to-bodyweight ratio accounts for body mass in real movement contexts in a way absolute load cannot. Critically, this ratio only becomes trustworthy when the underlying test is reliable. A 2020 systematic review found 1RM test-retest reliability at a median ICC of 0.97, with 92% of ICCs at or above 0.90, meaning when your ratio moves, it reflects genuine adaptation, not noise.
Beginner 1RM Strength Benchmarks - Squat, Bench, and Deadlift Starting Norms
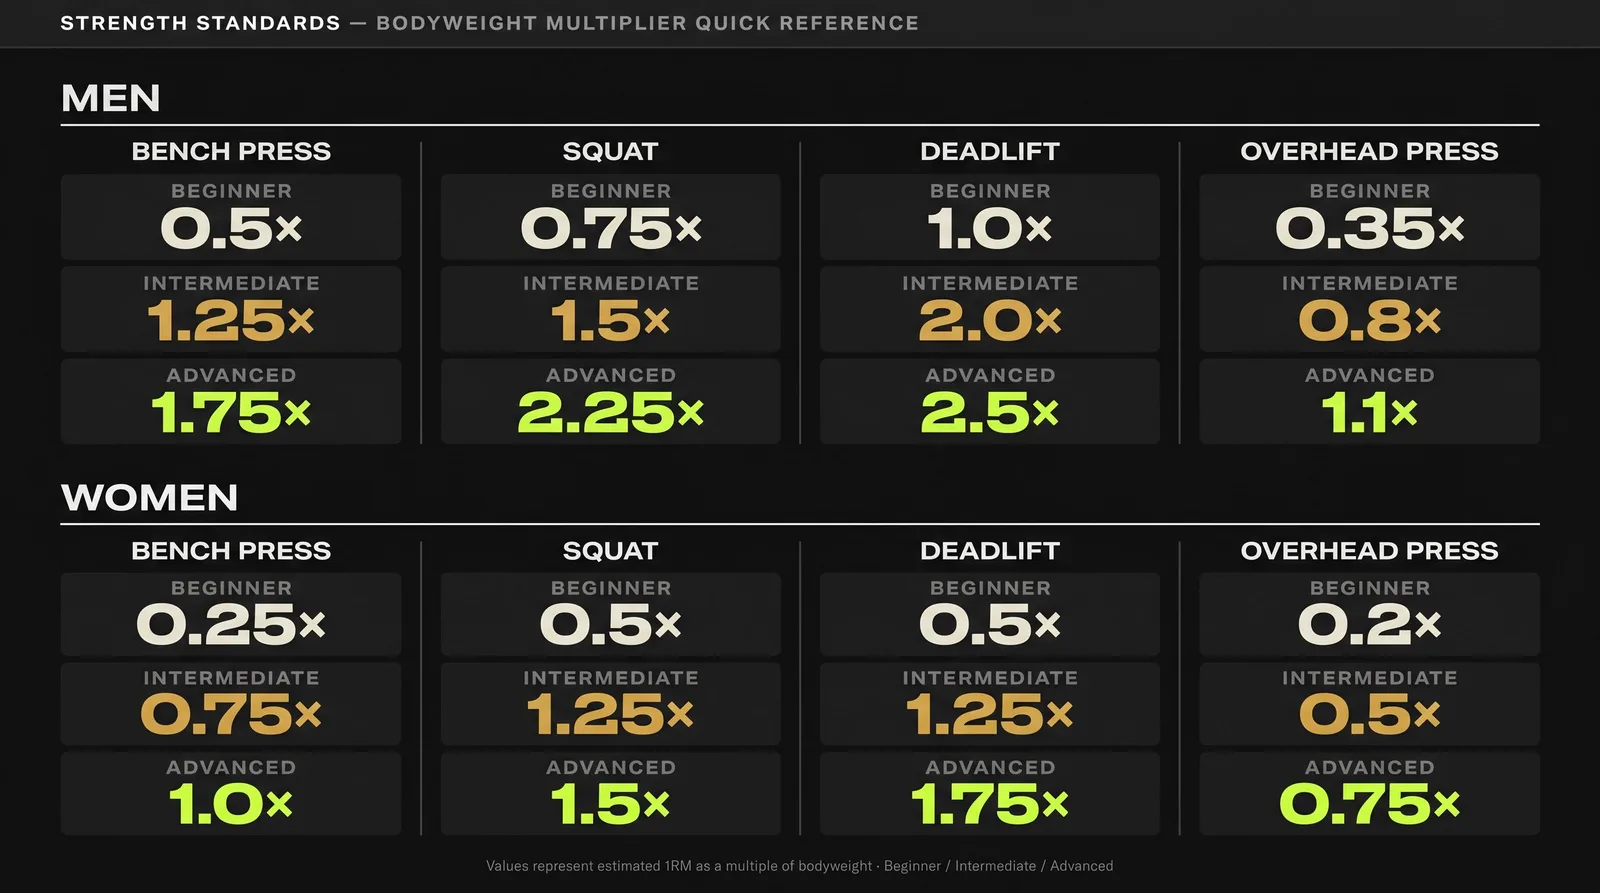
Concrete starting points matter because “I lifted more than last month” tells you nothing about where you actually stand. Objective fitness measurement norms position beginner benchmarks at roughly 1.0x bodyweight for the squat, 0.75x for the bench press, and 1.25x for the deadlift. These ratios give a beginner lifter a real target, not a feeling. The caveat: these are population-level starting points, not ceilings, and chasing a bigger raw number without tracking bodyweight on the same date makes the ratio meaningless.
Beginner Push-Up and Pull-Up Norms - Muscular Endurance Baselines for New Athletes
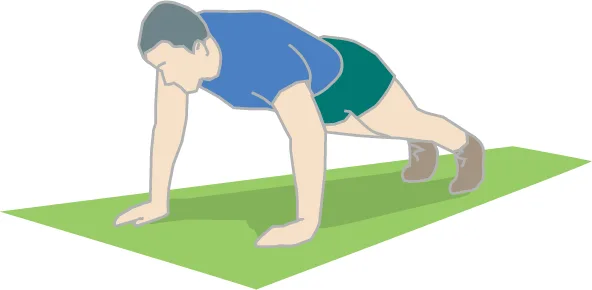
For men new to training, a functional starting baseline sits around 15 to 20 consecutive push-ups and 3 to 5 strict pull-ups; women’s baselines are lower given average relative upper-body strength differences. Preprints.org fitness assessment research frames these max-rep norms as the threshold that separates a developing muscular endurance base from a more established one. The practical problem most beginners face: they log a new squat PR and feel great, but without recording their bodyweight on the same date, they cannot calculate the ratio that signals athletic progress.
Most people handle this by keeping a notes-app log of their lifts, which works until they realize they never wrote down what they weighed that day. The result is a drawer full of PRs with no context and no way to know whether they are getting more athletic or just heavier. GetFit AI captures both bodyweight and workout data automatically, so every strength test result is expressed as a ratio the moment you log it, turning a single number into a trend an AI trainer can build a structured plan around.
That plan adapts as your numbers move, which matters because a plan you fall behind on and quit produces exactly the same result as no plan at all. GetFit AI’s Structured Training framework adjusts continuously across the overall training program arc, not just within a single session, so the program stays achievable as your capacity evolves. For athletes whose injury status changes week to week, that adaptability keeps them in the process long enough to build a real athletic profile.
GetFit AI is available on a Premium Weekly plan at $1.99, a Premium Monthly plan at $4.99, or a Premium Yearly plan at $49.99, giving you access to athlete-style custom programming and automatic ratio tracking at whichever commitment level fits where you are right now.
Absolute strength and muscular endurance give you the foundation. But a strong athlete who cannot change direction quickly is still a slow one. Next, we test the pillar that most gym-goers never even think to measure: agility and change-of-direction speed.
Athletic Performance Testing Methods for Agility and Change of Direction
You can be strong enough to squat twice your bodyweight and still look completely lost the moment you need to cut, pivot, or change direction under pressure. That gap, the one between gym strength and real athletic movement, is exactly what agility testing exposes. Two protocols close that gap fast: the Pro Agility Shuttle (5-10-5) and the Illinois Agility Test, both of which you can self-administer with four cones and a stopwatch.
1. Pro Agility Shuttle (5-10-5) - Protocol Breakdown
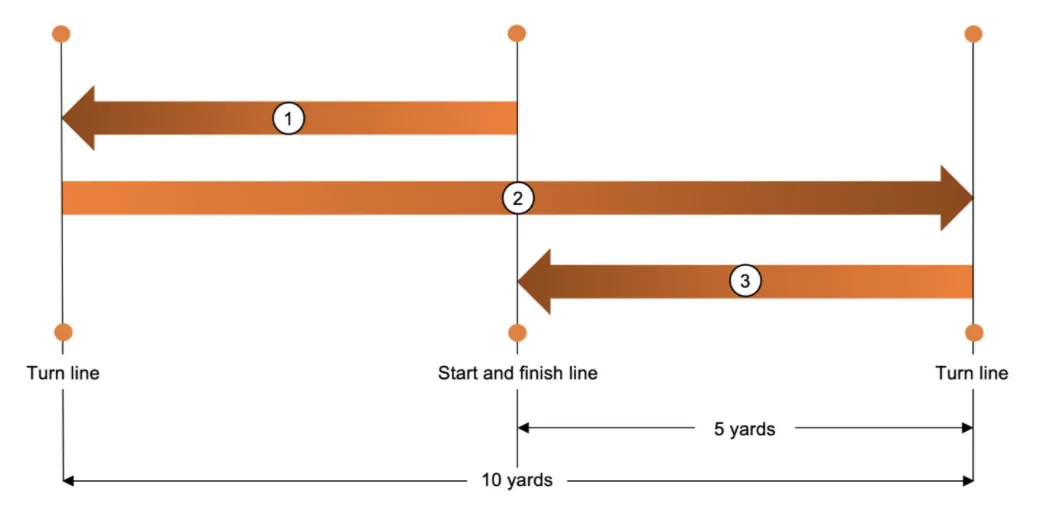
The Pro Agility Shuttle measures lateral quickness and the ability to change direction under acceleration. Across established performance tiers, the athlete starts at a midline, sprints 5 yards to one side, cuts and sprints 10 yards to the opposite side, then finishes 5 yards back through the midline. Solo setup requires three cones spaced 5 yards apart on a flat surface. Start a phone timer at your first movement. A result around 5.0 to 5.5 seconds places an untrained adult male in the average tier; anything above 6.0 seconds signals a meaningful change-of-direction deficit worth addressing directly in training.
2. Illinois Agility Test - Full Cone Course Protocol
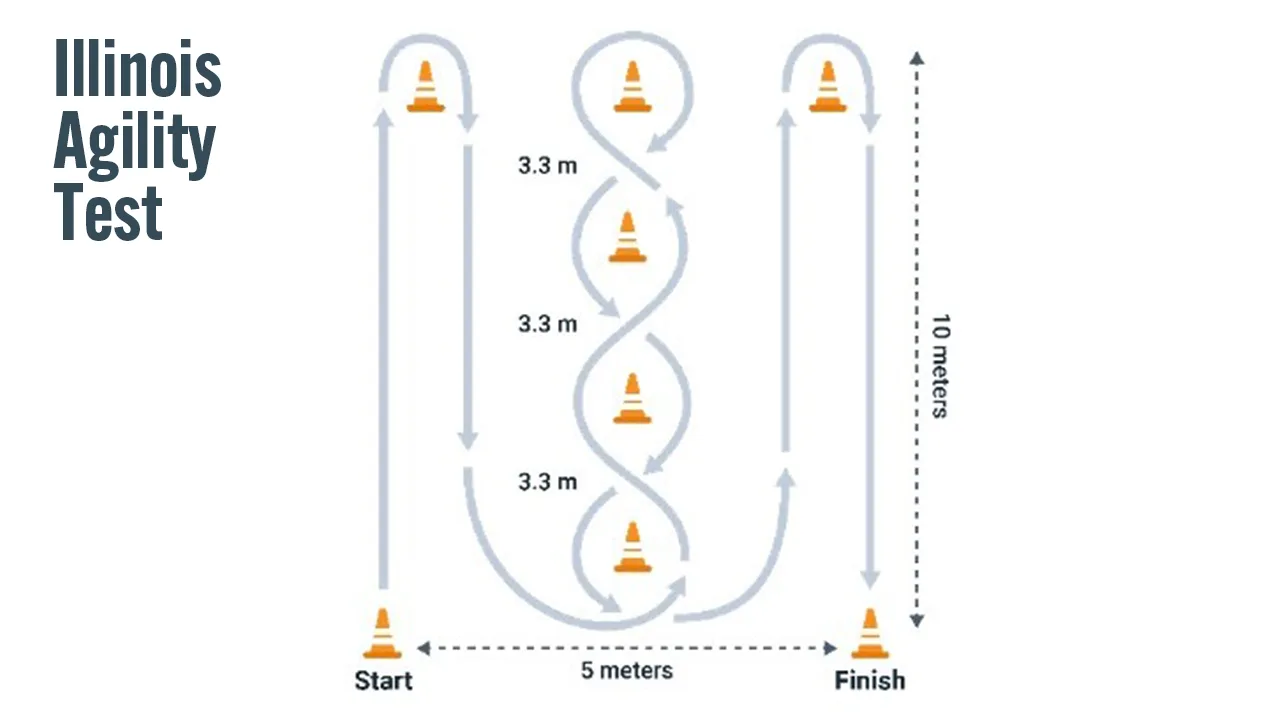
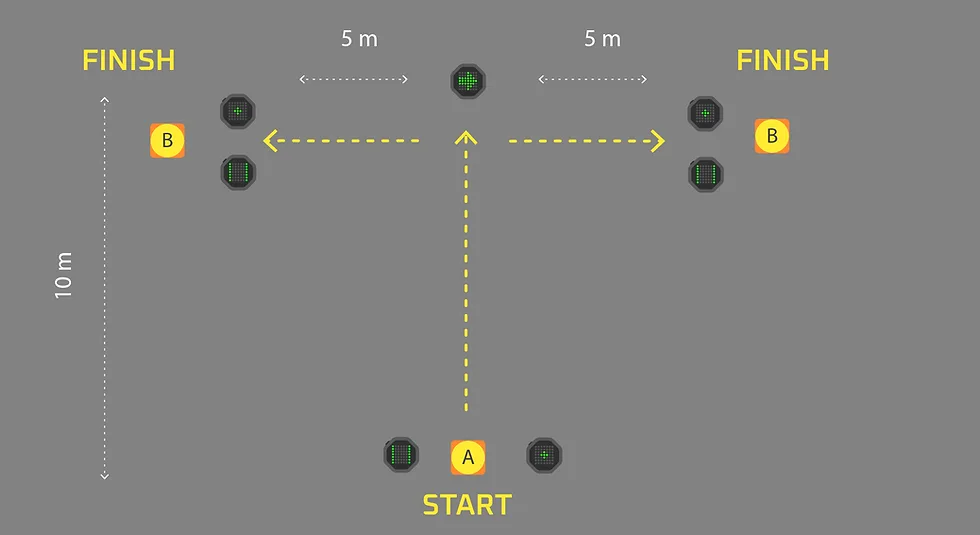
The Illinois Agility Test uses a 10m x 5m cone course to measure turning speed, deceleration, and overall maneuverability. The course is more complex than the shuttle’s simple lateral cuts. The athlete sprints the length, weaves through a slalom of four interior cones, then returns.
Cone placement accuracy matters: even a half-meter error in the 10m dimension meaningfully distorts your score and makes retesting unreliable. Measure twice before you run once. Performance tiers allow you to classify results as below average, average, or above average, giving you an objective benchmark rather than a vague sense of whether you felt quick.
Illinois Agility Test vs. Pro Agility Shuttle - Key Differences
The Pro Agility Shuttle isolates two bilateral cuts over a short 20-yard distance, making it ideal for pure lateral quickness assessment. The Illinois test covers a longer, more complex course with multiple directional changes, capturing maneuverability and sustained agility under mild fatigue. Coaches measuring athleticism should use both: the 5-10-5 for explosive lateral power and the Illinois for multi-directional coordination. Using only one test risks missing a significant dimension of an athlete’s movement profile.
Reactive vs. Pre-Planned Agility - Why the Distinction Matters for Athleticism
Both tests above are pre-planned: you know the course before you run it. Reactive agility, responding to an unpredictable visual cue, is a related but distinct quality. Research consistently shows only moderate correlation between pre-planned change-of-direction speed and reactive agility scores, meaning a fast shuttle time does not guarantee fast reactive movement in sport. For most beginners, pre-planned tests are the right starting point because they isolate the physical mechanics of cutting before adding the cognitive layer. Reactive agility testing is covered separately in the reaction time section of this battery.
Agility as the Missing Link Between Strength, Speed, and Sport Performance
Broader movement science frames agility tests as capturing reactive coordination, specifically the ability to decelerate, reorient, and re-accelerate, that pure speed or strength tests cannot measure. In concrete terms: an athlete who feels quicker but whose shuttle time is unchanged has objective evidence that their training is not yet producing the coordination gains they assumed. Feeling faster is not the same as being faster. Tiered norms make that belief falsifiable for the first time.
Most beginners log their lifts but never record a single agility time, so even a half-second improvement over eight weeks disappears into memory. GetFit AI’s workout analytics dashboard gives you a structured place to log shuttle and Illinois scores alongside your training sessions, turning a one-off cone drill into a trackable trend line that tells you exactly when your programming is, or is not, converting gym work into real athletic movement. One honest limitation: the dashboard tracks what you enter, so if your cone setup shifts between sessions, the data loses its validity. Consistent placement is the non-negotiable prerequisite.
Agility and change-of-direction scores tell you how well your body moves under pressure, but they say nothing about how long it can sustain that output. That question belongs to the next two measurements: cardiovascular endurance and flexibility, the often-overlooked pillars that determine whether your power and speed hold up past the first minute of real effort.
Related Reading
- Athletic Performance Analysis
- Does Vaping Affect Athletic Performance
- How to Avoid Feeling Sleepy After Workout
- How Does Sleep Affect Athletic Performance
- Velocity Based Training
- Building Stamina and Endurance
- Why Am I So Bad at Sports
- Endurance vs Strength Training
- Why Am I So Tired After Working Out
- How to Create a Personalized Workout Plan
Cardiovascular and Flexibility Measurements That Complete Your Athletic Profile
Finishing a 1.5-mile run in 13:30 versus 11:00 feels like a minor difference on paper. In practice, it reflects a VO2 max gap wide enough to determine whether your speed and power numbers hold up through a full training session or collapse by the halfway point.
“Post-COVID patients struggle with severely diminished aerobic capacity, as highlighted by the use of the 6-minute walk test (6MWT) as a key cardiovascular measurement to track recovery progress.”
— what we hear from post-COVID rehabilitation clinicians
Why These Two Tests Close the Profile
Aerobic capacity and flexibility are the infrastructure beneath your speed, power, and agility scores. As documented by the Thriving Wiki, higher VO2 max values are strongly associated with reduced chronic disease risk and greater long-term athletic sustainability, meaning these are not recovery-day extras. They are the foundation that determines how long your other numbers stay relevant.
Both tests require consistency to mean anything. A single sit-and-reach score or one timed mile tells you almost nothing without a comparison point. The value is in the trend, not the snapshot.
Most beginners log their lifts but never record a single endurance or flexibility score. When progress stalls, they have no data trail showing which pillar is the actual ceiling. GetFit AI closes that gap by tracking workout analytics alongside your performance trends across athlete-style custom workout plans, so the next training block targets the real constraint instead of the comfortable one. For users who have previously struggled with consistency due to lack of program structure, the structured training framework engages from the first workout session and carries through the overall program arc, an approach consistent with the systematic performance-tracking methodology supported by EBSCO database research cited later in this post.
Tests 8 and 9 round out the core athletic profile: a timed 1.5-mile run for aerobic capacity and the sit-and-reach for flexibility.
1. 1.5-Mile Timed Run - The Gold-Standard Field Test for Aerobic Capacity

Run 1.5 miles on a flat surface, as fast as possible, and record your finish time. That single number estimates your VO2 max without a lab, because the 1.5-mile run is a validated field-test proxy for aerobic capacity used across military, clinical, and sports-science settings. Research published on Semantic Scholar confirms that timed running performance reliably estimates average VO2 max across populations, validating the test as a genuine data point rather than a rough approximation. For men under 30, sub-9:45 signals above-average cardiovascular endurance; for women, sub-12:00 is the benchmark. The gap between 13:30 and 11:00 is two and a half minutes and a VO2 max difference large enough to determine whether your speed and power hold through a full session or collapse at the halfway point.
2. Sit-and-Reach Test Protocol - Measuring Hamstring and Lower Back Flexibility
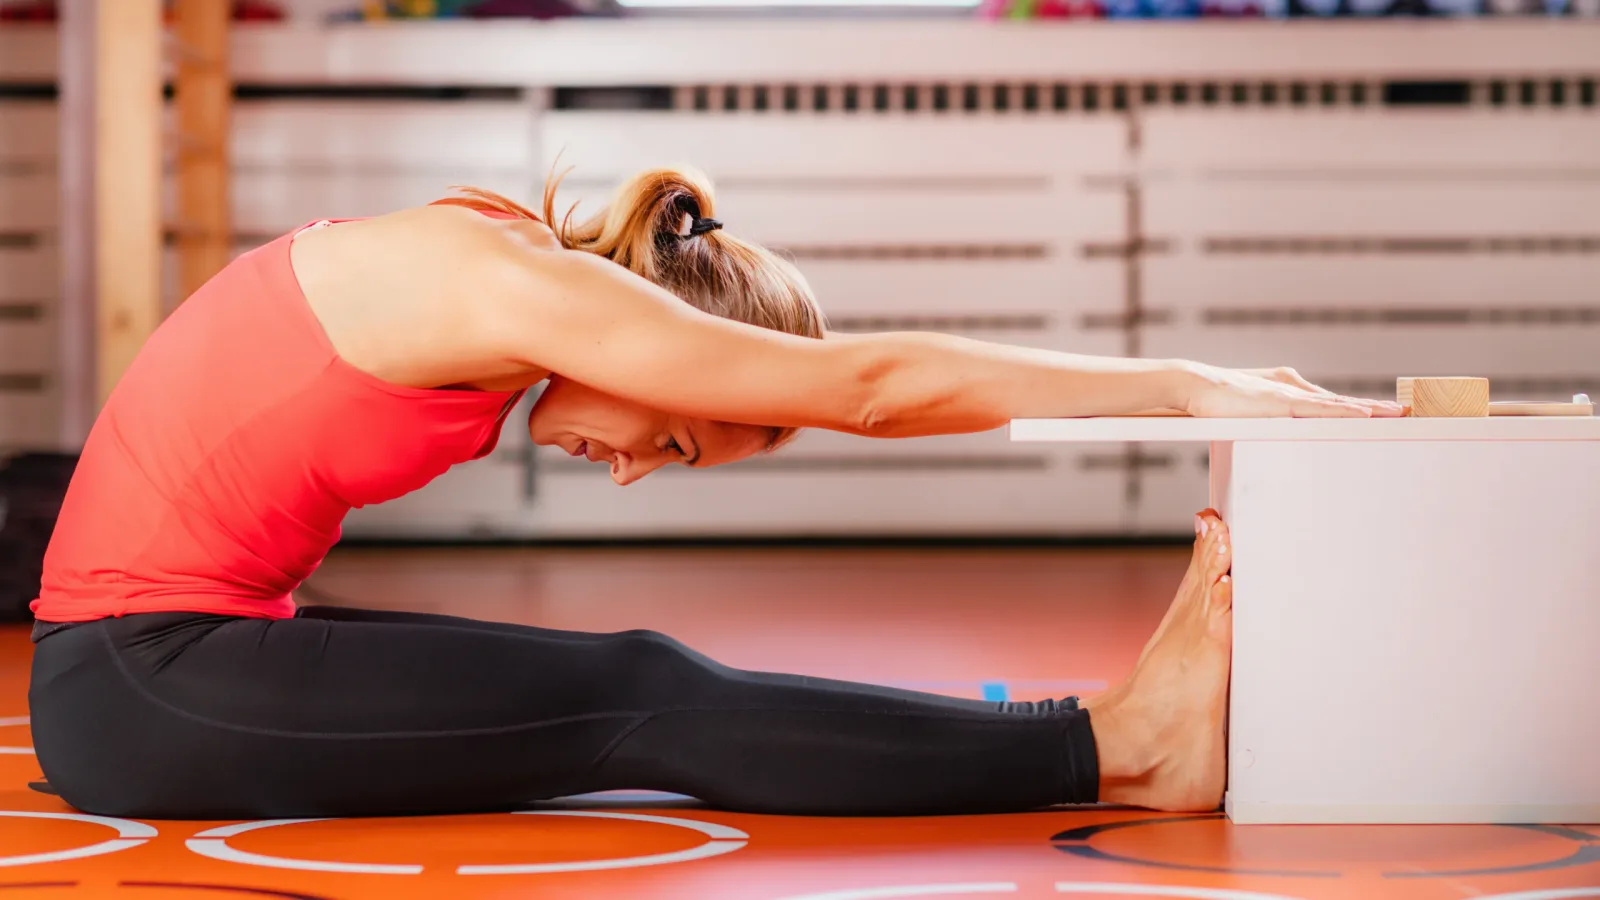
Sit on the floor with legs fully extended, feet flat against a box or wall, and reach forward as far as possible along a measuring tape. A positive score (past your toes) signals above-average hamstring and lower back flexibility for adults under 30; a negative score (short of your toes) flags restricted range of motion that research consistently links to elevated injury risk and reduced force output in compound lifts. The test takes under two minutes and requires no equipment, making it the most practical flexibility measurement in a field-based athletic battery.
Flexibility and Movement Efficiency - How Range of Motion Amplifies Speed and Power
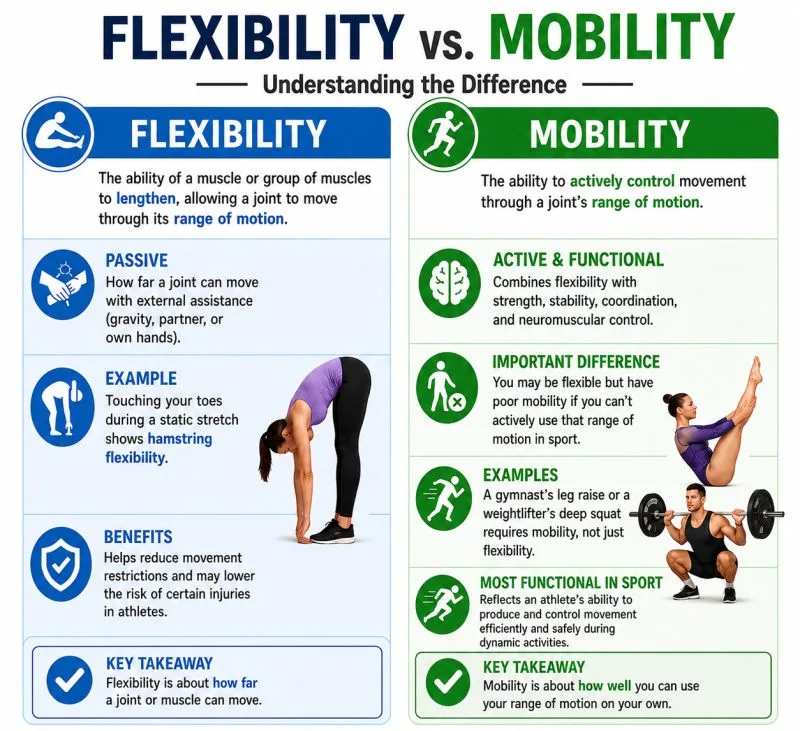
Restricted hamstrings act as a brake on movements you already tested earlier in this battery. A tight posterior chain compresses stride length in your 40-yard dash, limits hip drive in your vertical jump, and reduces depth in your squat, all without showing up as a weakness in your strength numbers. Range of motion is the mechanical prerequisite that lets force transfer. Athletes who score well on power and speed but poorly on the sit-and-reach are often one training block away from a soft-tissue injury that erases months of progress.
Endurance and Mobility as Athletic Infrastructure - Why These Two Metrics Complete the Profile
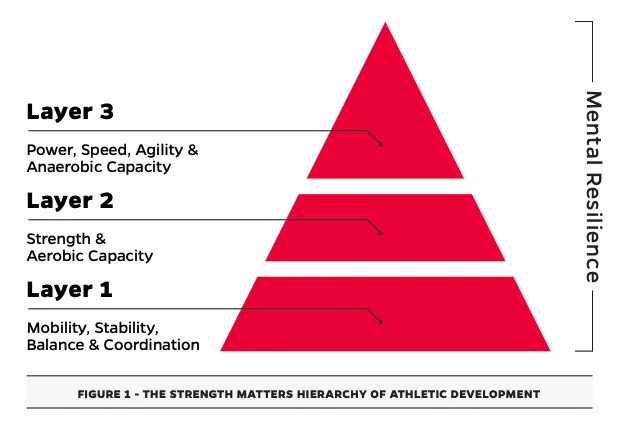
As the Thriving Wiki documents, higher VO2 max values are strongly associated with reduced chronic disease risk and long-term athletic sustainability, so aerobic capacity is the energy system that keeps every other athletic quality functional under real training volume. Flexibility serves the same structural role for your joints. Together, tests 8 and 9 answer the question the first seven tests cannot: will your numbers hold up over time, or are they already eroding beneath the surface? Without both, your athletic profile has a foundation problem rather than a performance gap.
Understanding where you stand on VO2 max is also a longevity signal, not just an athletic one. The Thriving Wiki connects aerobic capacity directly to longevity risk, which means your 1.5-mile time carries stakes well beyond athletic performance. Most adults never get this data point because they assume it requires clinical testing. It does not, and once you have it, a platform like GetFit AI can build athlete-style custom workout plans around it rather than forcing you into a generic program that ignores your actual aerobic ceiling.
Scoring Framework Overview - How to Tally Your Results Across All 11 Tests
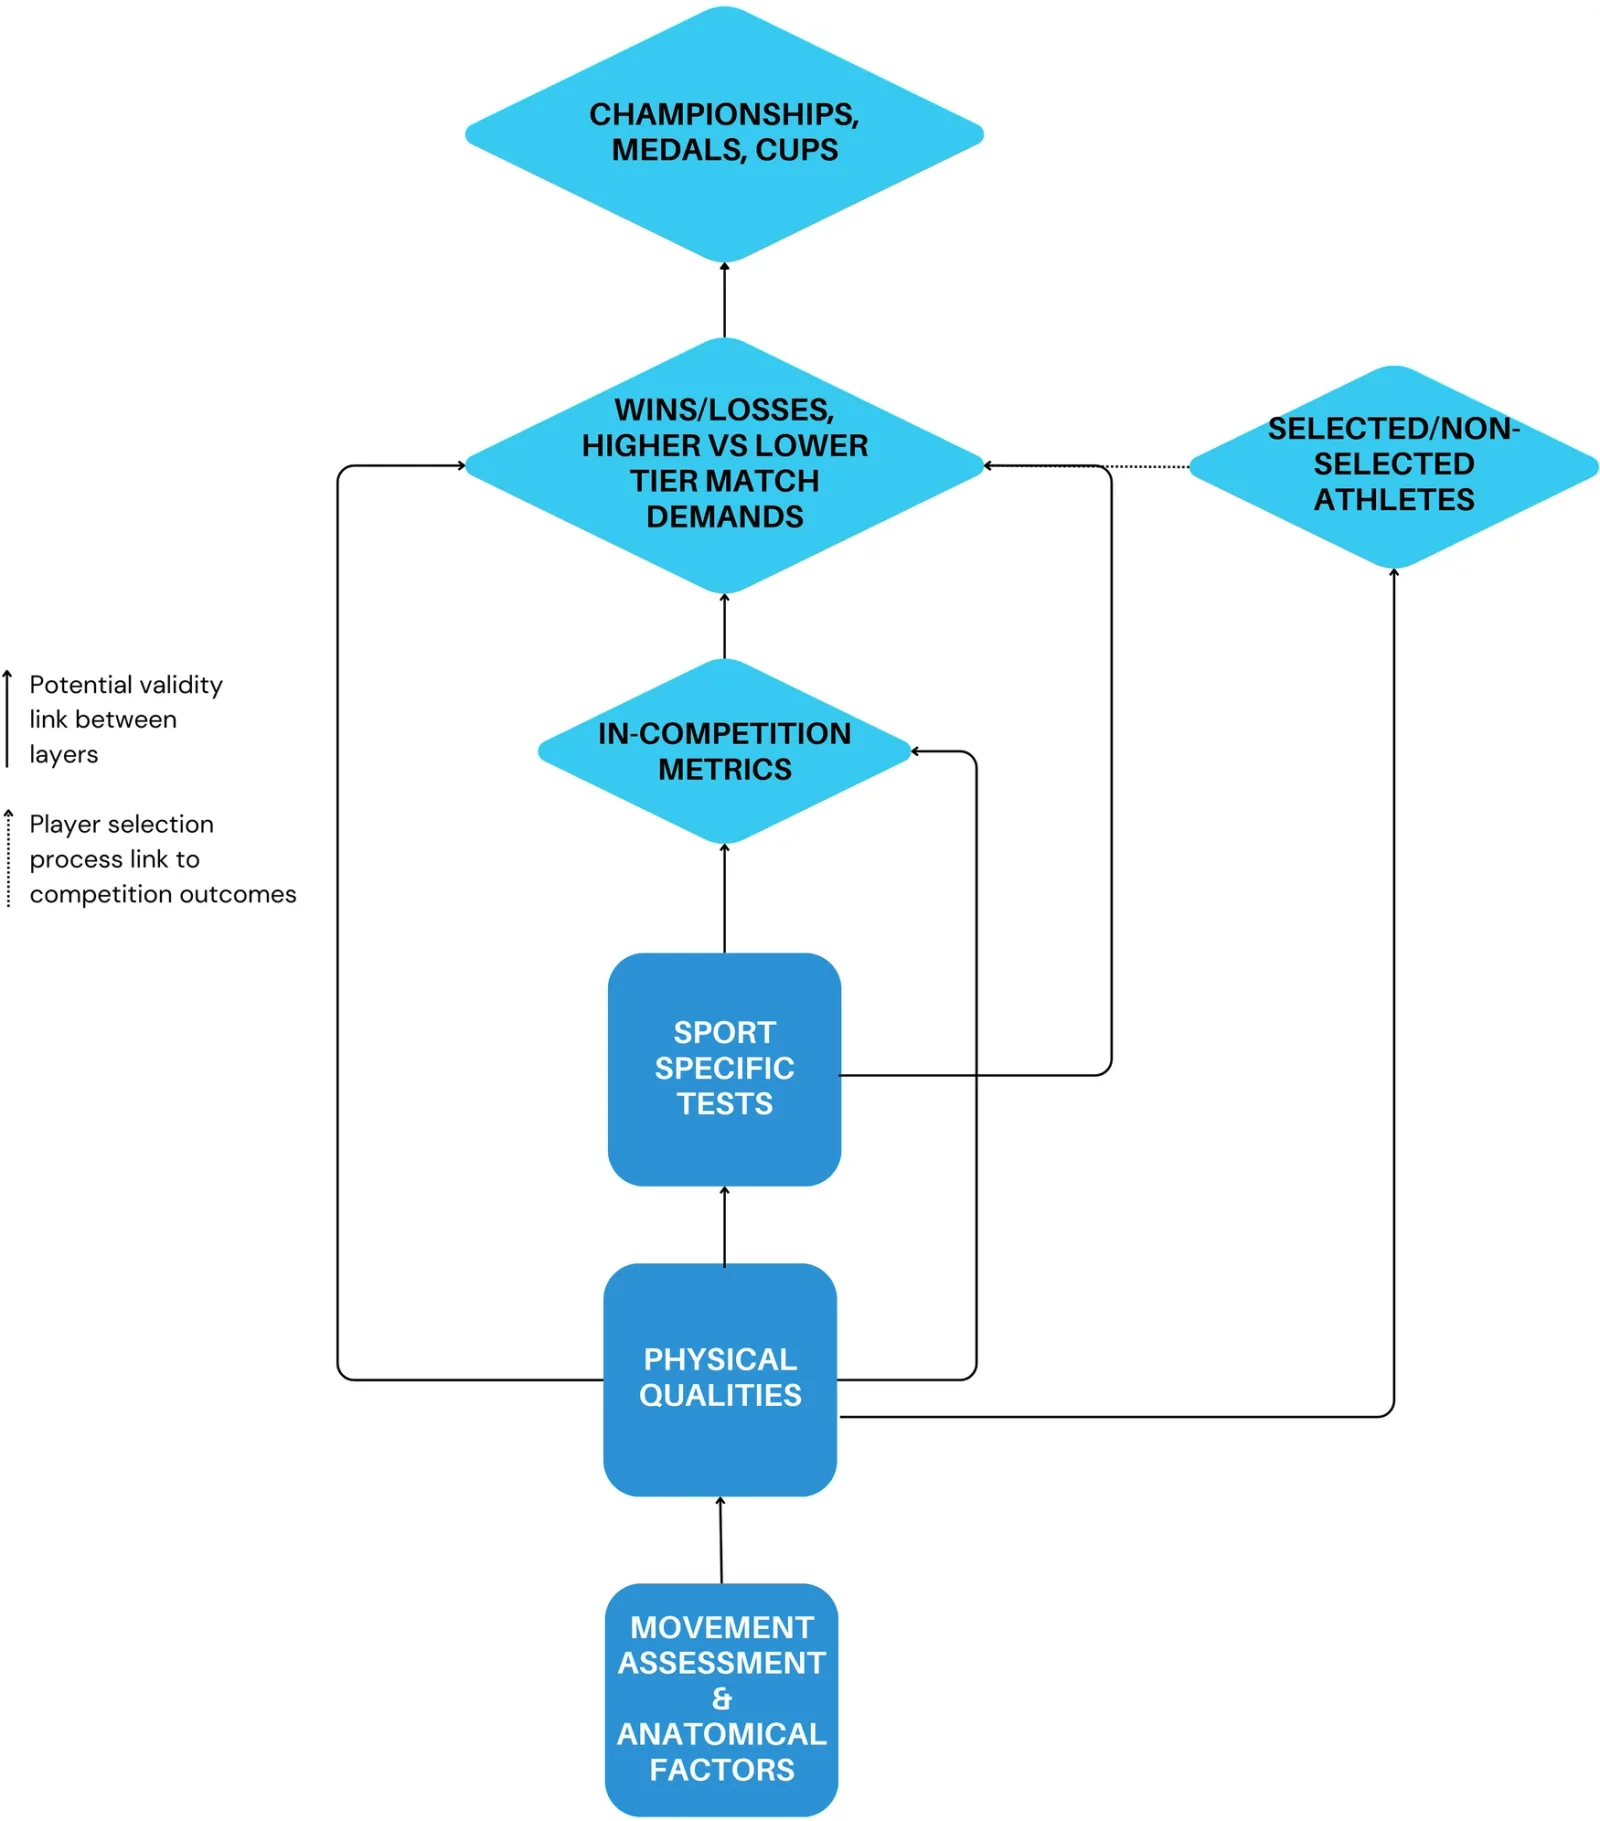
After completing all 11 tests, count how many scores land above the age-normed average for your demographic. That total becomes your composite athletic score. The tiers are straightforward: 8 to 11 above-average scores indicate a well-rounded athletic profile; 4 to 7 suggest a functional base with clear development priorities; 0 to 3 signal that foundational work across multiple pillars is the most productive place to start. The count-based method works because a simple above-average tally is a valid self-classification method supported by composite performance research, and it keeps the framework actionable without requiring a sports scientist to interpret the results.
Developing Athlete Tier (0-3 Above Average) - What It Means and Where to Focus
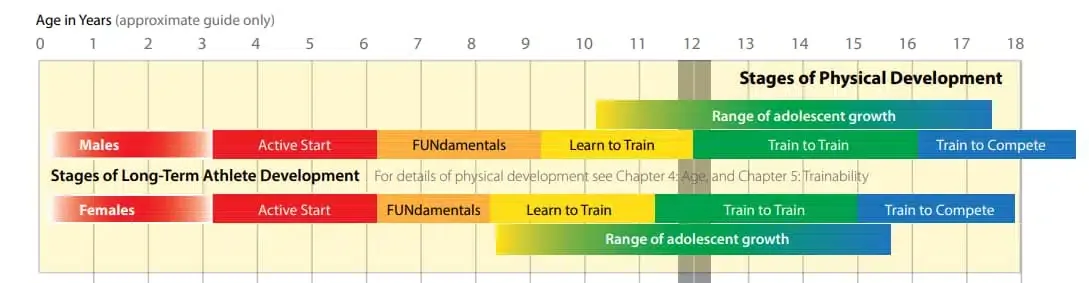
Scoring 0 to 3 above-average results does not mean you are unfit; it means your athletic profile has multiple underdeveloped pillars competing for the same training attention. The productive move is to rank your lowest scores by gap size and address the largest deficits first. A slow mile time paired with a negative sit-and-reach score, for example, points directly to aerobic base work and mobility training as the highest-return priorities before adding more volume to speed or strength. Chasing all pillars simultaneously at this stage spreads adaptation too thin and stalls progress across the board.
This is precisely where a plan that adapts, rather than one that stays fixed while you fall further behind, makes the difference between sustainable progress and abandonment. GetFit AI’s structured training framework and athlete-style custom workout plans are available starting at $1.99 per week on the Premium Weekly Subscription, $4.99 per month on the Premium Monthly Subscription, or $49.99 per year on the Premium Yearly Subscription, giving developing athletes access to programming that tracks their actual constraints and adjusts accordingly from the very first session.
Related Reading
- How to Deal With Performance Anxiety in Sports
- Hydration Tips for Athletes
- How to Build Mental Toughness in Athletes
- Food for Athletes During Competition
- Strength Training Workout for Runners
- Best Plyometric Exercises for Speed
- Exercises That Improve Muscular Endurance
- Conditioning Workouts for Athletes
- Speed Training for Athletes
- Balance Exercises for Athletes
- Best Core Exercises for Athletes
Two Bonus Athletic Performance Measurements Worth Adding to Your Testing Battery
Ranking deficits by gap size applies just as cleanly to strength as it does to aerobic capacity or mobility, and nowhere is that gap more deceptive than when raw load increases while bodyweight rises in step with it. A heavier squat number feels like progress, but if your bodyweight climbed alongside it, you may not be any more athletic than you were three months ago. That gap is exactly what Tests 10 and 11 close.
Test 10 - Bodyweight-to-Strength Ratio
Relative strength, calculated by dividing your one-rep max by your bodyweight, tells you how strong you are for your size. This ratio is a more meaningful athletic marker than absolute load lifted because it accounts for body size and tracks strength changes independent of weight fluctuations. A recreational athlete squatting 1.0 times bodyweight reads very differently from one squatting 0.9 times, even when the raw kilograms look close, a distinction Deadweight Supply Co. reinforces when contextualizing load relative to an athlete’s size class. The honest trade-off: norms for this ratio are less standardized than for sprint or jump tests, so your most useful benchmark is your own previous score, not a population table.
Test 11 - The Drop-Ruler Reaction Time Drill
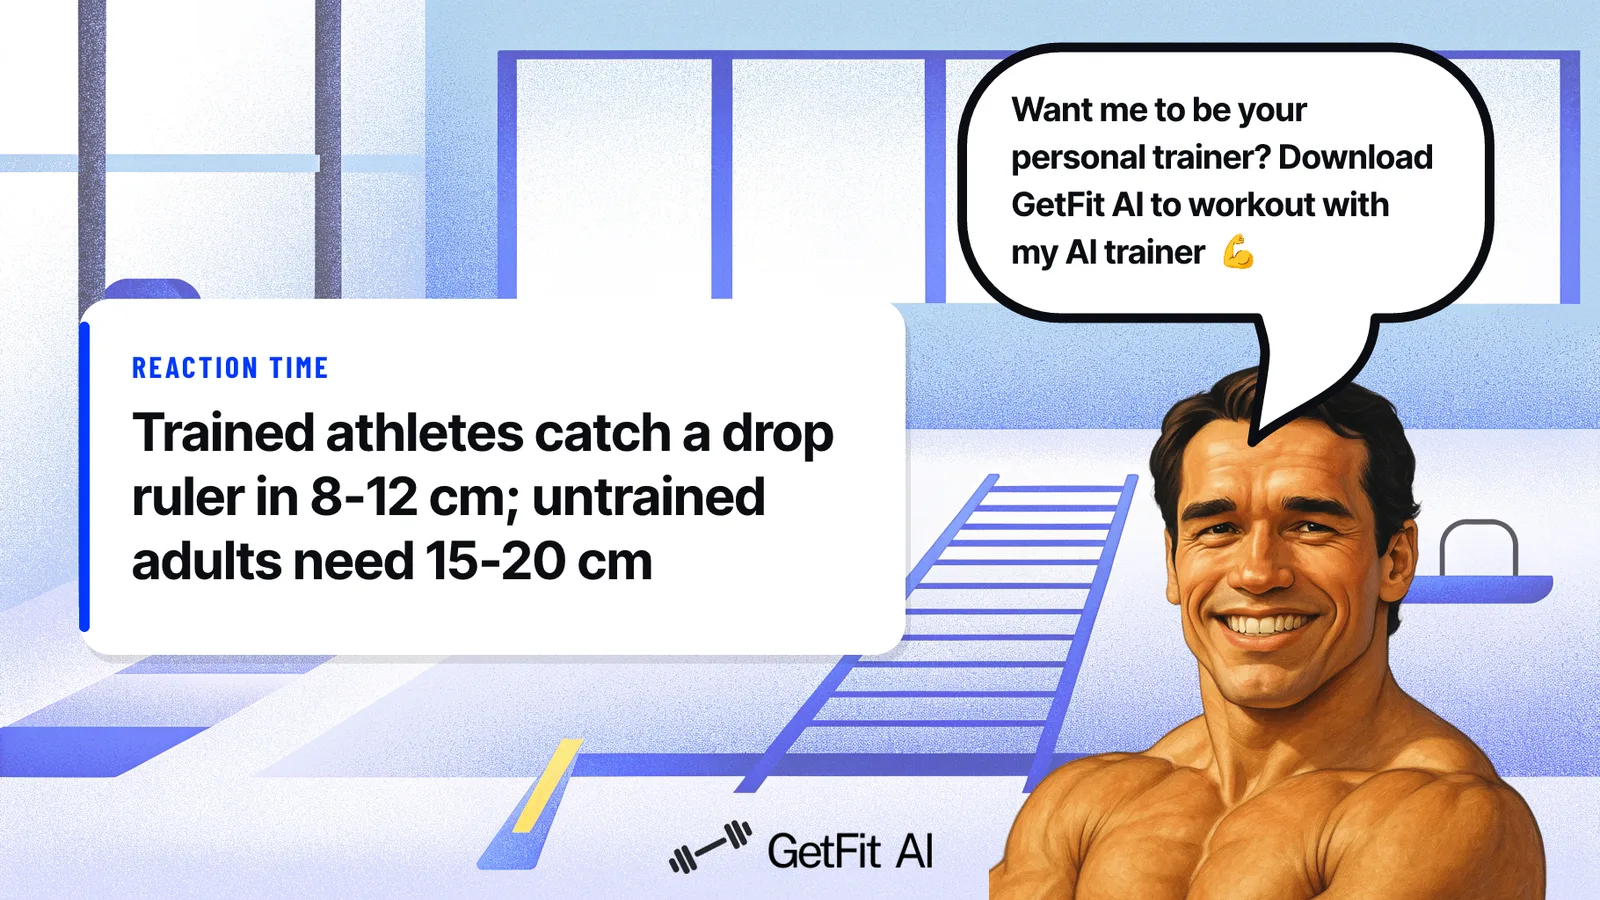
Drop a ruler without warning, catch it, measure the distance. That distance converts directly to milliseconds of reactive speed.
Reaction time bridges agility scores and real-sport performance because sport demands responses to unpredictable cues. An untrained adult typically catches the ruler around 15 to 20 centimeters from the drop; trained athletes average closer to 8 to 12 centimeters. No equipment beyond a ruler is required, which makes it one of the lowest-barrier tests in the entire battery.
Personal Improvement vs. Population Norms
Most beginners log a squat number and forget it. Without tracking the bodyweight-to-strength ratio alongside it, a heavier lift and a heavier body look identical on paper. GetFit AI’s workout analytics dashboard logs both variables together, so every retest produces a visible trend rather than a number buried in a notes app. Broader industry trends point to retesting every 4 to 6 weeks to generate a trend line rather than a one-time snapshot. That cadence is the point: two data points tell you direction; six tell you velocity.
This is also where having a specific performance target sharpens everything. GetFit AI’s Athlete-Style Custom Workout Plans are most beneficial when you have a clear athletic role model and a specific physique or performance goal, because that goal converts an abstract ratio into a concrete target ratio to chase. If your reference point is a sport you want to compete in or an athlete whose movement profile you want to match, a bodyweight-to-strength score becomes a direct progress signal rather than a number without context.
Similarly, GetFit AI’s Structured Training feature is most beneficial for users who have previously struggled with consistency due to lack of program structure, and it activates from the very first workout session, building the week-over-week habit that turns a one-time test battery into a repeatable improvement cycle that runs during each workout session and across the overall training program arc.
The real question, with all 11 tests mapped, is how to turn those scores into a training plan that changes week to week. That is exactly what the next section breaks down.
How Tracking and Monitoring Athletic Progress Turns Test Scores into a Training Plan
The real gap most beginners face is a complete absence of structure for what happens after test day: no retest date, no logging format, no way to know whether Monday’s workout should look any different from last Monday’s.
The 4-to-6-Week Retest Cadence That Turns a Snapshot Into a Trend
Research from the EBSCO database is direct on this point: systematic performance tracking requires logging scores in a consistent format and comparing each metric to your own prior results, not to population norms, so that your individual progress curve drives training decisions. A four-to-six-week retest window gives enough time for meaningful physiological adaptation while keeping the feedback loop short enough to catch a stalled metric before it becomes a plateau you have been living with for months.
-
Log each test, the date, and the raw result in one place, every time
-
Use no reformatting and no rounding
-
Compare each new score to your own prior results, not to population norms
How Weak Test Scores Become Your Next Training Priorities
University of Debrecen sports physiology research confirms that aerobic and anaerobic performance zones have distinct trainability profiles. A low vertical jump and a slow 1.5-mile time require completely different training stimuli to fix, so identifying which zone is lagging is the essential first step before adjusting any program.
You can run the same pace at the same feeling of exertion and be dramatically fitter or less fit than six weeks ago, which is precisely why the numbers matter more than perceived effort alone.
How to Convert Your Benchmark Scores Into a Dynamic, Athlete-Style Training Roadmap
The GetFit AI app closes that gap by treating each benchmark result as a live input inside its workout analytics dashboard. A low vertical jump and a weak Pro Agility score map directly to a power-and-agility-focused custom workout plan, built in the style of an athlete whose training you actually want to follow, updated as your scores move. It is most beneficial when you have completed at least one full testing battery and want the measurements to drive programming rather than sit in a spreadsheet.
One honest trade-off: the system depends on you retesting consistently, so without that recurring input the recommendations will drift out of sync with where your fitness actually stands.
Next steps
If you have been training month after month with no clear sense of whether anything is actually changing, the path forward starts with treating athletic progress as something you measure, not something you feel. A single 20-minute testing session gives you the concrete baseline that turns every future workout into a data point. Start with our AI fitness app.
Two findings from this battery make the next step obvious. First, because athleticism is genuinely multi-dimensional, speed, power, strength, agility, and endurance each form their own independent trend line, no mirror check or scale number can tell you which pillar is quietly capping your results. Second, relative strength, your 1RM divided by your bodyweight, only becomes a trustworthy signal when it is tracked reliably across repeated windows, and the same logic applies to every score in this battery.
A shuttle time logged once is a curiosity. A shuttle time logged every four to six weeks is a training decision. Together, those two realities point to one action: get your scores into a system that converts them into a program, not a notes app you stop checking.
Start with the AI fitness app that takes your benchmark results and builds an athlete-style custom workout plan around them, adjusting each training block as your numbers move. Log your baselines today, schedule your first retest in four to six weeks, and let the data drive the programming from there.
Frequently Asked Questions
What age do men hit their athletic peak, and why does it matter when I start testing?
For most athletic qualities, sprints, jumps, and throws, men peak around age 25, with strength plateauing between 35 and 40 before declining by roughly 25 percent by age 65. If you are between 25 and 30 right now, you are at or near your biological ceiling for most athletic qualities, which makes a baseline taken today a concrete reference point that every future training decision depends on.
What are average scores for the 40-yard dash, vertical jump, and broad jump for someone who isn’t a pro athlete?
Untrained adults typically clock between 5.5 and 6.5 seconds in the 40-yard dash, land between 12 and 20 inches on the vertical jump, and cover around 5 to 6 feet on the standing broad jump. Those ranges give you a realistic starting benchmark before comparing yourself to combine-level athletes like NFL skill-position players, who average 4.4 to 4.6 seconds, or NBA draft prospects, who average around 28 inches on the vertical.
Can I measure my own athleticism without expensive lab equipment?
Yes, the 40-yard dash, vertical jump, and standing broad jump each require nothing more than flat ground, a tape measure, chalk, and a stopwatch, and they can all be run in a parking lot or a gym in about 20 minutes. The one honest limitation is that self-timing with a phone introduces roughly 0.1 to 0.3 seconds of error on the sprint, so recruiting a friend to hold the stopwatch improves accuracy if precision matters to you.
Why is looking lean in the mirror not a reliable indicator of athletic ability?
Body-composition metrics like BMI and scale weight capture mass distribution, not performance outputs like power, reactive agility, or nervous-system speed. A 2023 University of Alabama study found that BMI showed no significant correlation with field-based athletic performance metrics in youth soccer players, and the post gives a concrete example of someone who drops 10 pounds but stalls on the same pull-up count for six straight months, they look different but perform identically.
Is there a single fitness number or test that captures overall athleticism?
No, sports scientists converge on five distinct qualities that together define athletic capacity: speed, power, strength, agility, and endurance, and each can fail independently of the others. The NFL Combine uses a six-test battery precisely because no single drill captures the full picture, and a person can score well on one dimension while performing poorly on three others, which the post describes as the norm for most recreational gym-goers.