Grip Strength Norms by Age and Gender [2026 Chart]
Your grip score predicts heart attack risk better than blood pressure. Here is what your number actually means, and why finding out is only half the work.
Most people treat grip strength as a novelty, something measured once and forgotten. The common assumption is that the number is just a curiosity, that looking it up tells you where you stand, and that’s enough. The research points elsewhere. It also predicted all-cause mortality, heart attack, and stroke across high-, middle-, and low-income populations alike. That is a globally replicated signal hiding inside a 10-second squeeze. See our AI fitness app for how this works in practice.
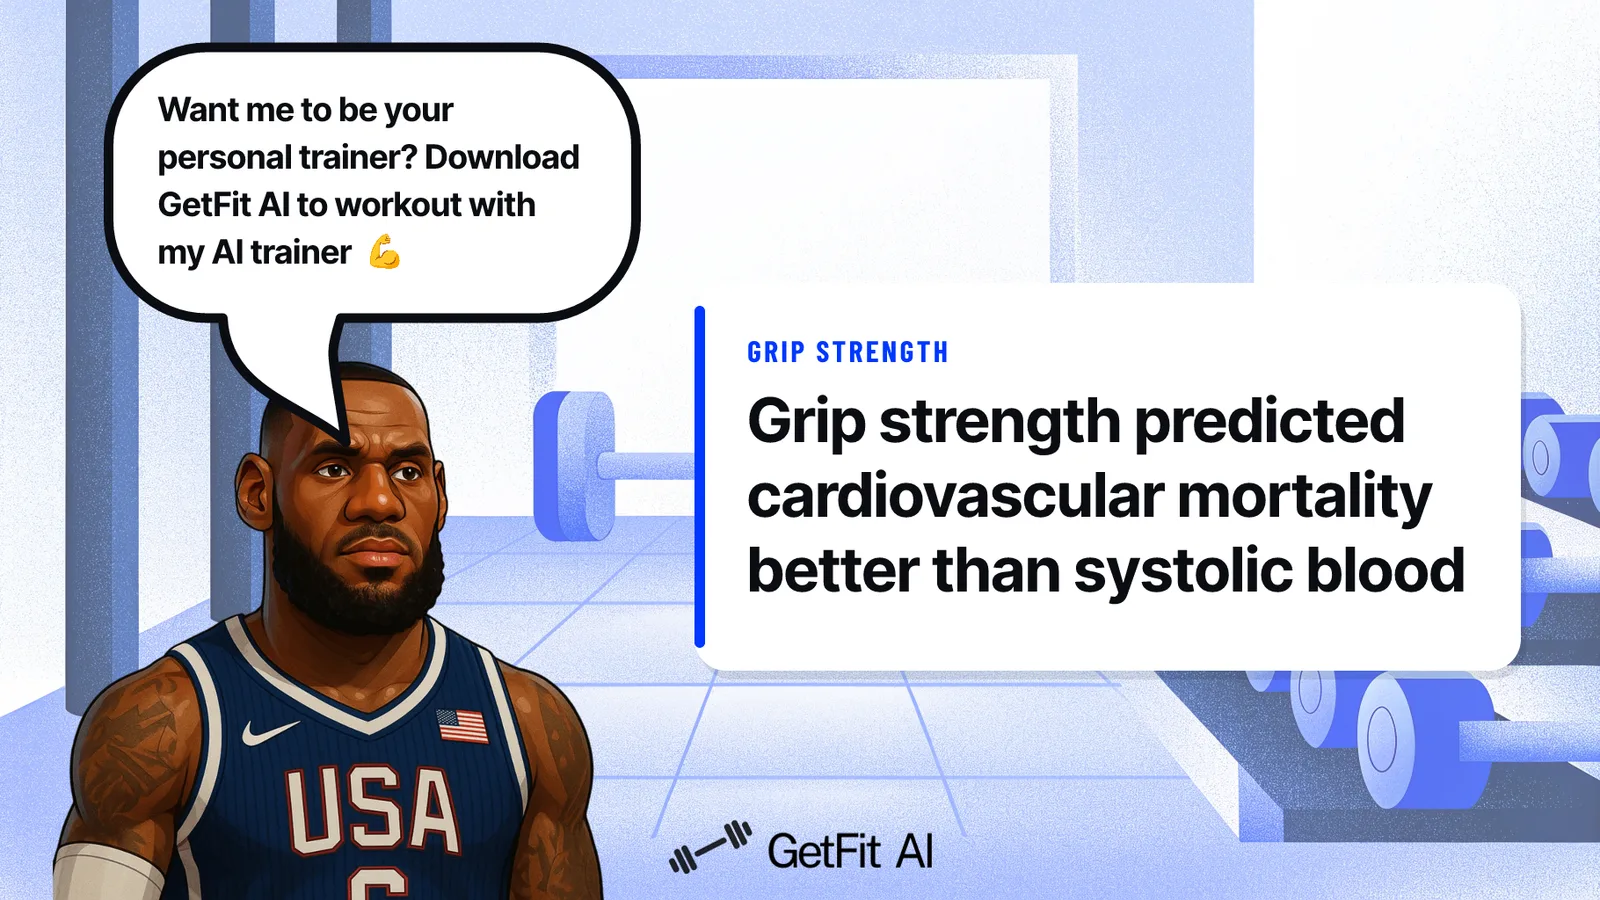
Grip strength was a stronger predictor of cardiovascular mortality than systolic blood pressure. Bench press numbers fluctuate with sleep, caffeine, and how long you rested between sets.
Mile time shifts with weather and motivation. Grip strength, measured correctly, cuts through that noise.
It reflects lean muscle mass, neuromuscular integrity, and systemic aging biology in a single reading. A Wu et al. meta-analysis published in the Journal of the American Medical Directors Association (2017) confirmed grip strength as a clinically meaningful predictor of all-cause mortality, cardiovascular disease, and cancer risk in community-dwelling populations. The metrics most people chase are performance outputs. Grip strength is a window into the body’s actual condition. That is where most people stall.
Key takeaways
- Grip strength is one of the strongest independent predictors of cardiovascular mortality and all-cause longevity, the PURE study tracked over 140,000 people across 17 countries to establish that.
- A grip score only means something when it's placed against population norms stratified by your age and sex, a raw number without that context tells you nothing actionable.
- Testing protocol matters more than most people realize: wrong posture, wrong elbow angle, or a single trial instead of three can shift your result enough to land you in the wrong category entirely.
- Low grip strength isn't a fitness quirk, a 2024 NHANES analysis links it to metabolic dysfunction, sarcopenia risk, and all-cause mortality, making it a clinically validated biomarker, not a gym novelty.
- A norms chart is a population snapshot, not a training prescription, it can't tell you how many sets to do, when to add load, or when to back off.
- GetFit AI's free fitness calculators, 32 tools covering BMI, BMR, TDEE, macros, body fat, one-rep max, protein, and more, all grounded in published research, connect your grip score to the full picture your training plan actually needs to respond to it.
Grip Strength Norms by Age and Gender: 2026 Reference Chart
Seeing a number on a dynamometer readout without knowing what it means is like checking your bank balance in a currency you don’t recognize. The figure exists, but it carries no weight until you place it against the right reference point. That reference point is a population-validated normative table, stratified by age and sex, and it’s the same tool clinicians use to flag health risk long before symptoms appear. For most beginners, the deeper struggle isn’t measuring grip strength; it’s not knowing what to do with the number once they have it, and having no structured system that translates a raw result into a clear next step for training and nutrition. That gap between data and action is exactly what GetFit AI is built to close.
How Normative Ranges Are Built: Why Age and Sex Stratification Is Non-Negotiable
Normal grip strength for a 28-year-old man is not normal for a 55-year-old woman. Most people who look up a single “average” figure online are comparing themselves to a blended population number that flattens out the very differences that make the data useful. According to Camry Electronic Hand Dynamometer normative data, compiled by Topend Sports, normative ranges are built from large samples of community-dwelling adults tested under standardized conditions, then sorted into age bands and separated by sex.
The International Journal of Sports Physical Therapy, Jordre & Schweinle reinforce the same stratification logic in their reference standards, requiring that maximum grip be reported as the mean of three trials with the subject seated and the elbow flexed at exactly 90 degrees. Without that structure, two people with identical raw scores could be at completely different points on the health risk curve.
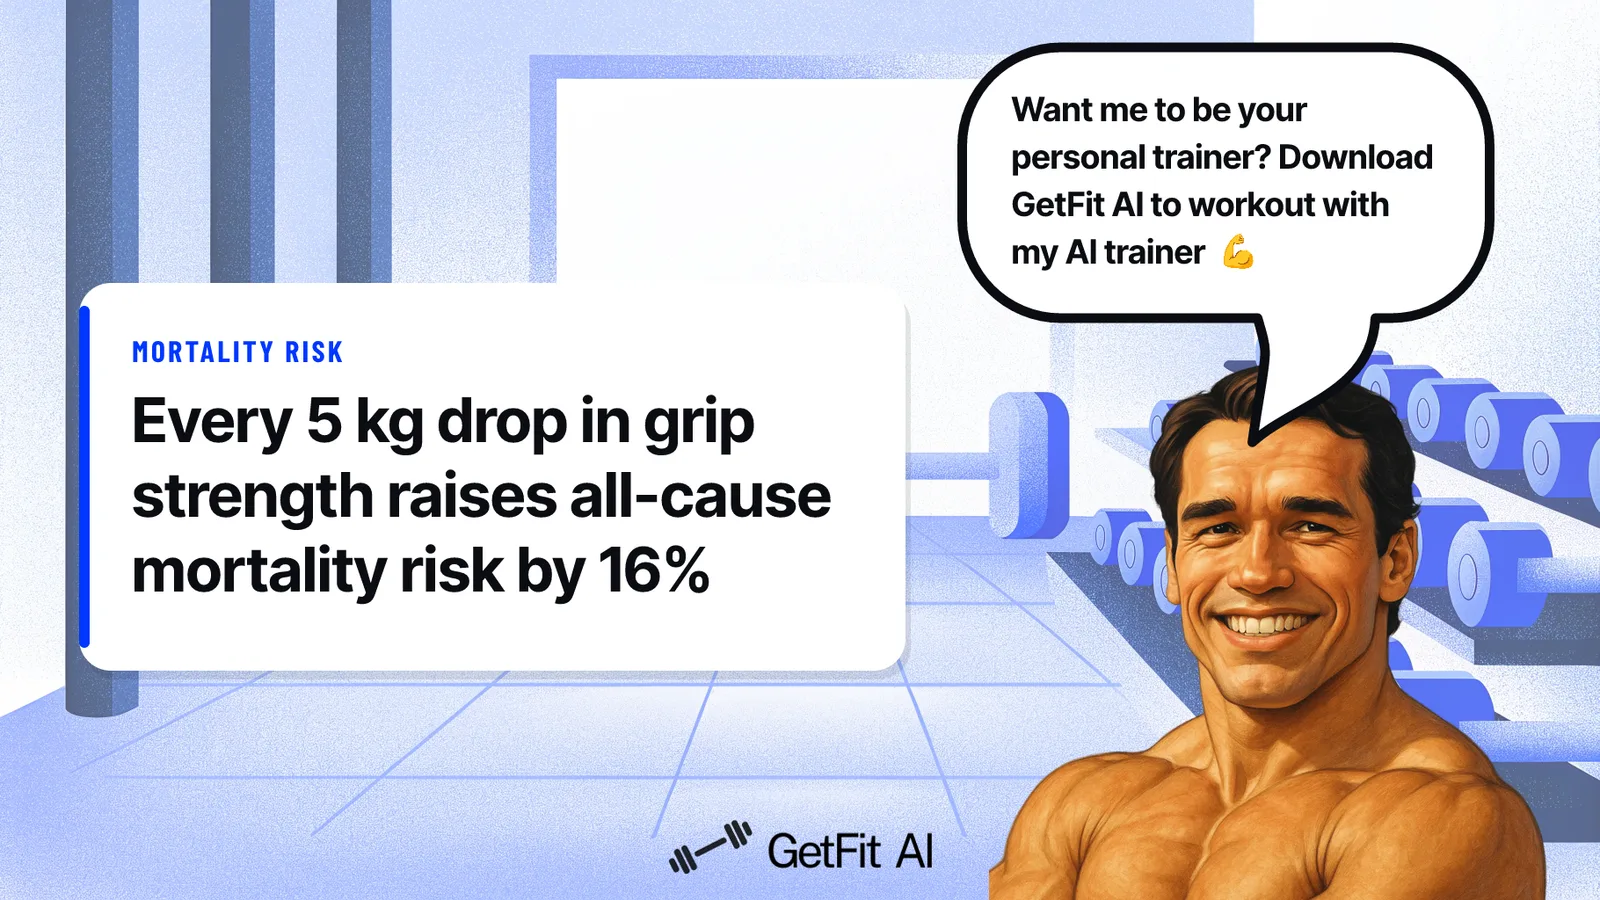
The decade in which you first test your grip strength determines how much urgency your score carries. Normative data shows men lose a substantial amount of grip strength between their peak years (ages 25-29) and their seventies, a multi-decade decline that compounds steadily, and NHANES mortality data confirms that every 5 kg drop carries a 16% increase in all-cause mortality risk. A 35-year-old who scores at the low end of “normal” is already spending mortality currency and has more decades of compounding loss ahead than a 65-year-old at the same absolute number. Age-stratified norms tell you where you stand today; they do not automatically tell you how fast the floor is dropping beneath you.
This is where a structured training system pays dividends that a static table cannot. One of the most common failure patterns we see among beginners is achieving an initial result, even a good one, and then losing consistency past the first few weeks because there is no program architecture pulling them forward. GetFit AI’s Athlete-Style Custom Workout Plans are designed for people who have previously struggled with consistency due to lack of program structure; the plan activates from your first workout session and guides each session and the overall training arc, so the floor doesn’t drop through neglect.
The social layer, friends, challenges, and leaderboards, becomes most powerful after you connect with at least one friend in the app, functioning as the retention mechanism that keeps users training past week three, precisely when motivation without accountability typically collapses.
Nutrition is the other half of the equation that normative tables ignore entirely. Knowing your grip score sits in the “weak” band for your age group is actionable only if you know what to eat to change it, and if you can track that intake without doing the math yourself. GetFit AI handles both: the app tells you exactly what to eat to hit your goal and tracks it automatically, removing the arithmetic burden that causes most beginners to abandon nutrition tracking within days.
If you want consistent access to all of these tools, structured plans, nutrition tracking, social accountability, and progress benchmarking, GetFit AI’s Premium plans start at $1.99 per week (billed weekly), $4.99 per month (billed monthly), or $49.99 per year (billed yearly), making the full system accessible at whatever commitment level suits where you are right now.
2026 Grip Strength Norms by Age and Gender
Normal grip strength for adults by age and sex, sourced from Camry Electronic Hand Dynamometer normative data, compiled by Topend Sports:
| Age Group | Men: Weak (kg / lbs) | Men: Normal (kg / lbs) | Men: Strong (kg / lbs) | Women: Weak (kg / lbs) | Women: Normal (kg / lbs) | Women: Strong (kg / lbs) |
|---|---|---|---|---|---|---|
| 20-24 | Below 36.8 / 81 | 36.8-56.6 / 81-125 | Above 56.6 / 125 | Below 21.5 / 47 | 21.5-35.3 / 47-78 | Above 35.3 / 78 |
| 25-29 | Below 37.7 / 83 | 37.7-57.5 / 83-127 | Above 57.5 / 127 | Below 25.6 / 56 | 25.6-41.4 / 56-91 | Above 41.4 / 91 |
| 30-39 | Below 36.0 / 79 | 36.0-56.0 / 79-123 | Above 56.0 / 123 | Below 21.0 / 46 | 21.0-35.3 / 46-78 | Above 35.3 / 78 |
Related Reading
- Best Fitness Apps
- How Many Pull Ups Should I Be Able To Do
- Average Grip Strength Male
- Average Bench Press
- How Much Does A Bench Press Bar Weigh
- Average Male Bench Press
- How Much Can The Average Man Bench Press
- Grip Strength Chart
- Symmetric Strength
- Bench Press Standards
How to Measure Grip Strength Correctly: The Standard Testing Protocol
Getting a grip strength score wrong is surprisingly easy, and most people never find out they did it. The testing conditions that make your number comparable to population norms are specific, and a single deviation, the wrong posture, one trial instead of three, an arm that’s too straight, can shift your result by enough to push you into the wrong category entirely. Many beginners measure grip strength, get a number, and compare it to a chart without realizing the number was generated under conditions that make the comparison meaningless.
“Users are not aware of what constitutes a standard or clinically validated protocol for measuring grip strength, the discussion covers grip strength extensively but never mentions how to properly test or measure it.”
— what we hear from fitness and health enthusiasts
The One Tool That Makes Your Score Comparable to Population Norms
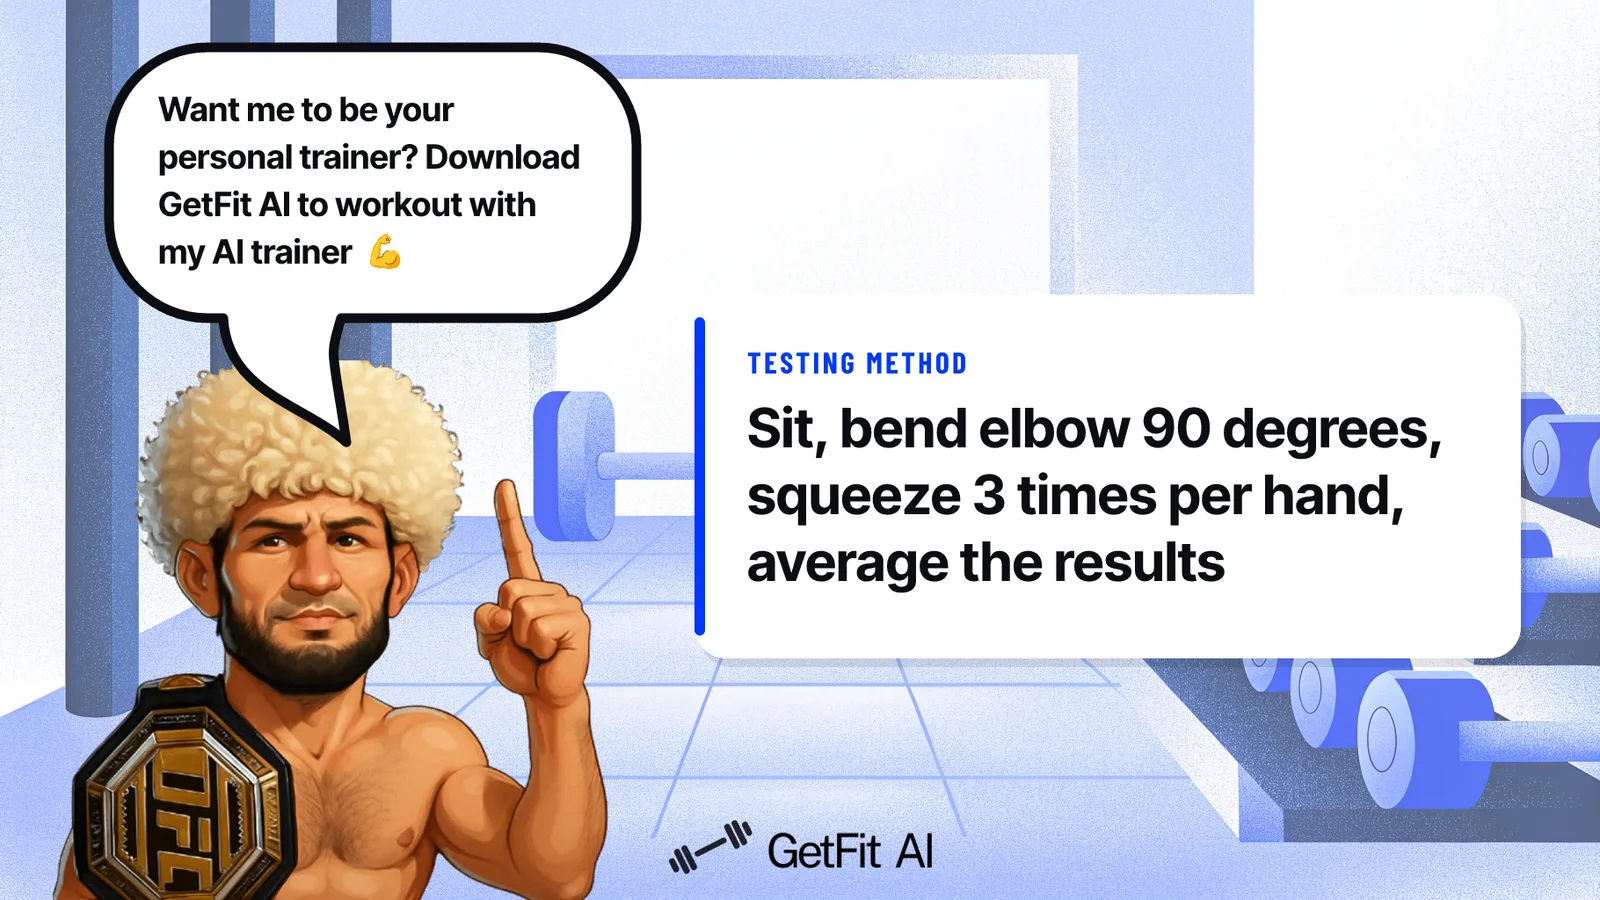
A hand-held dynamometer is the tool you need to measure grip strength correctly. Squeeze it seated, elbow bent at 90 degrees, and average three trials per hand. That one-sentence answer is the entire protocol in its simplest form, and it matters because every normative table you’ll compare yourself against was built using exactly these conditions.
The Shirley Ryan AbilityLab RehabMeasures Database confirms that the standard protocol requires a seated position, forearm in neutral, wrist between 0 and 30 degrees of extension, and three maximal trials per hand with the mean recorded. A cross-sectional study comparing dynamometry devices, published in the Measurement of hand grip strength: A cross-sectional study of two dynamometry devices, The South African Journal of Physiotherapy, further reinforces that consistent device use and standardized positioning are prerequisites for scores that translate meaningfully to population norms.
Deviate from any of those conditions and your score is no longer speaking the same language as the norms.
The Exact Seated Protocol Clinicians Use
Elbow at 90 degrees, three trials, both hands, these are the conditions that make your score meaningful. The 90-degree elbow angle places the forearm flexors at their optimal length-tension relationship, producing a repeatable, maximal contraction. Three trials matter because grip strength fluctuates between attempts; averaging them smooths that noise and gives you a score that reflects actual capacity rather than a lucky or unlucky single rep.
This is precisely where structured tracking earns its value. Most beginners we work with don’t struggle with effort; they struggle with knowing what to track and whether they’re doing it correctly. GetFit AI’s Athlete-Style Custom Workout Plans are built around removing exactly that uncertainty: the app tells you what to do, logs the results, and does the math so you’re not left guessing whether today’s number means anything. You get the structure from the first workout session, and it carries through the full program arc, so your grip data accumulates into a trend you can actually interpret, rather than a collection of one-off numbers you can’t compare.
Dominant vs. Non-Dominant Hand: Why You Must Record Both
Record both hands, every time.
According to the Shirley Ryan AbilityLab RehabMeasures Database (2023), the dominant hand is typically 10% stronger than the non-dominant hand, and that asymmetry is clinically meaningful. A gap larger than 10% can flag a real deficit or early pathology that a single-hand test would miss entirely, which is why clinicians record both sides on every assessment, not just the dominant hand.
Knowing what to record is half the battle; the other half is actually doing it consistently. GetFit AI’s structured tracking handles the second half. Log both hands each session, and the app carries the math forward without you having to maintain a separate spreadsheet or remember last month’s baseline. For users who’ve previously struggled with consistency due to lack of program structure, that continuity is the difference between a single data point and a meaningful performance trend.
What Low Grip Strength Really Means for Your Health and Longevity
Most people check their grip strength number, compare it to a chart, and think that is the end of the story. It is not. Low grip strength is a clinically validated signal tied to cardiovascular disease risk and all-cause mortality, with research showing the relationship is dose-response: every kilogram counts, not just falling below an arbitrary cutoff.
Grip Strength as a Clinically Validated Biomarker
Low grip strength is a genuine health indicator that carries real clinical weight. A 2024 analysis of NHANES 2011-2014 data by Chai, Zhang, and Fan in Scientific Reports confirmed that grip strength independently associates with all-cause mortality, cardiovascular disease risk, and sarcopenia. The associations held after controlling for age, sex, and body size, which tells you the signal is not just a proxy for being generally healthy.
The Cardiovascular and All-Cause Mortality Link
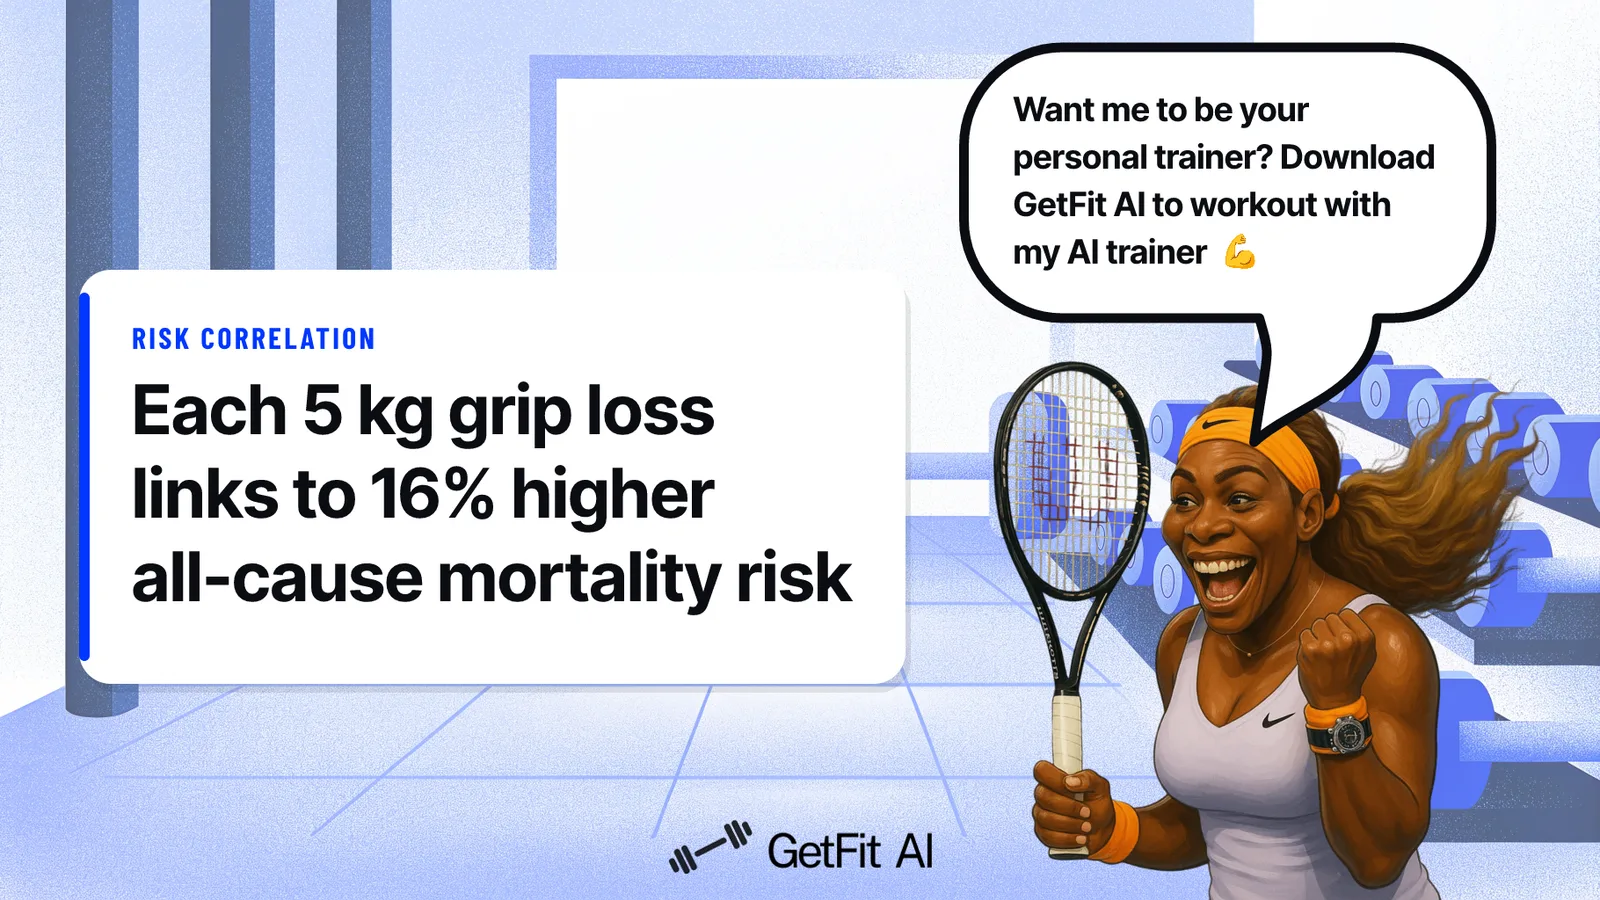
The effect sizes here are not small. A 2017 meta-analysis by Wu et al. in the Journal of the American Medical Directors Association-2/abstract) found that each 5 kg drop in grip strength was linked to a 16% higher risk of all-cause mortality and a 17% higher risk of cardiovascular disease across prospective cohort studies. The Chai et al. NHANES study corroborated this, reporting a hazard ratio of 1.16 (95% CI 1.12-1.20) per 5 kg decrease. That is a dose-response relationship, so every kilogram lost carries independent weight.
EWGSOP2 Clinical Cutoffs for Sarcopenia Risk
Low grip strength, in a clinical context, means something specific. The European Working Group on Sarcopenia in Older People (EWGSOP2, 2019 consensus) sets established screening thresholds for both men and women, below which a result flags probable sarcopenia and warrants both medical and training attention. A 55-year-old man scoring 24 kg does not just have a “weak grip.” He falls below the threshold that flags probable sarcopenia and warrants both medical and training attention.
Why the Decline After 60 Is the Number to Watch Now
Grip strength peaks in your late twenties to mid-thirties, then erodes slowly until around age 60, when the rate of loss accelerates. Population data from NHANES shows that the trajectory after 60 is steep enough that adults who enter that decade with already-marginal scores can cross clinical thresholds within a single decade without any acute illness.
Modifiable Factors That Accelerate or Protect Against Decline
Age and sex are fixed. Protein intake, training consistency, and sleep quality are not. Adequate dietary protein, at levels broadly supported by the resistance-training literature, supports muscle protein synthesis; progressive resistance training directly stimulates the neuromuscular adaptations that grip strength reflects; and chronic sleep restriction has been independently associated with accelerated loss of lean mass. These are levers. The clinical thresholds exist to tell you when to start pulling them, before you are past them.
Related Reading
- Do Pull Ups Work Chest
- Average Deadlift Weight
- 1 Rep Max Chart
- Average Male Deadlift
- Good Bench Press Weight
- Weightlifting Standards
- Average Bench Press Kg By Age
- Average Deadlift Weight Kg
Your Grip Strength Score Is Only Useful If You Have a Plan That Responds to It
Knowing where your grip strength falls on a norms chart is a reasonable starting point, but that number does nothing on its own. The gap between having a score and actually improving it comes down to whether you have a plan that responds to it over time, and most people do not. This section breaks down why population benchmarks stall without progressive programming behind them, and how GetFit AI is built to close that gap.
A Population Benchmark Is a Snapshot, Not a Training Prescription
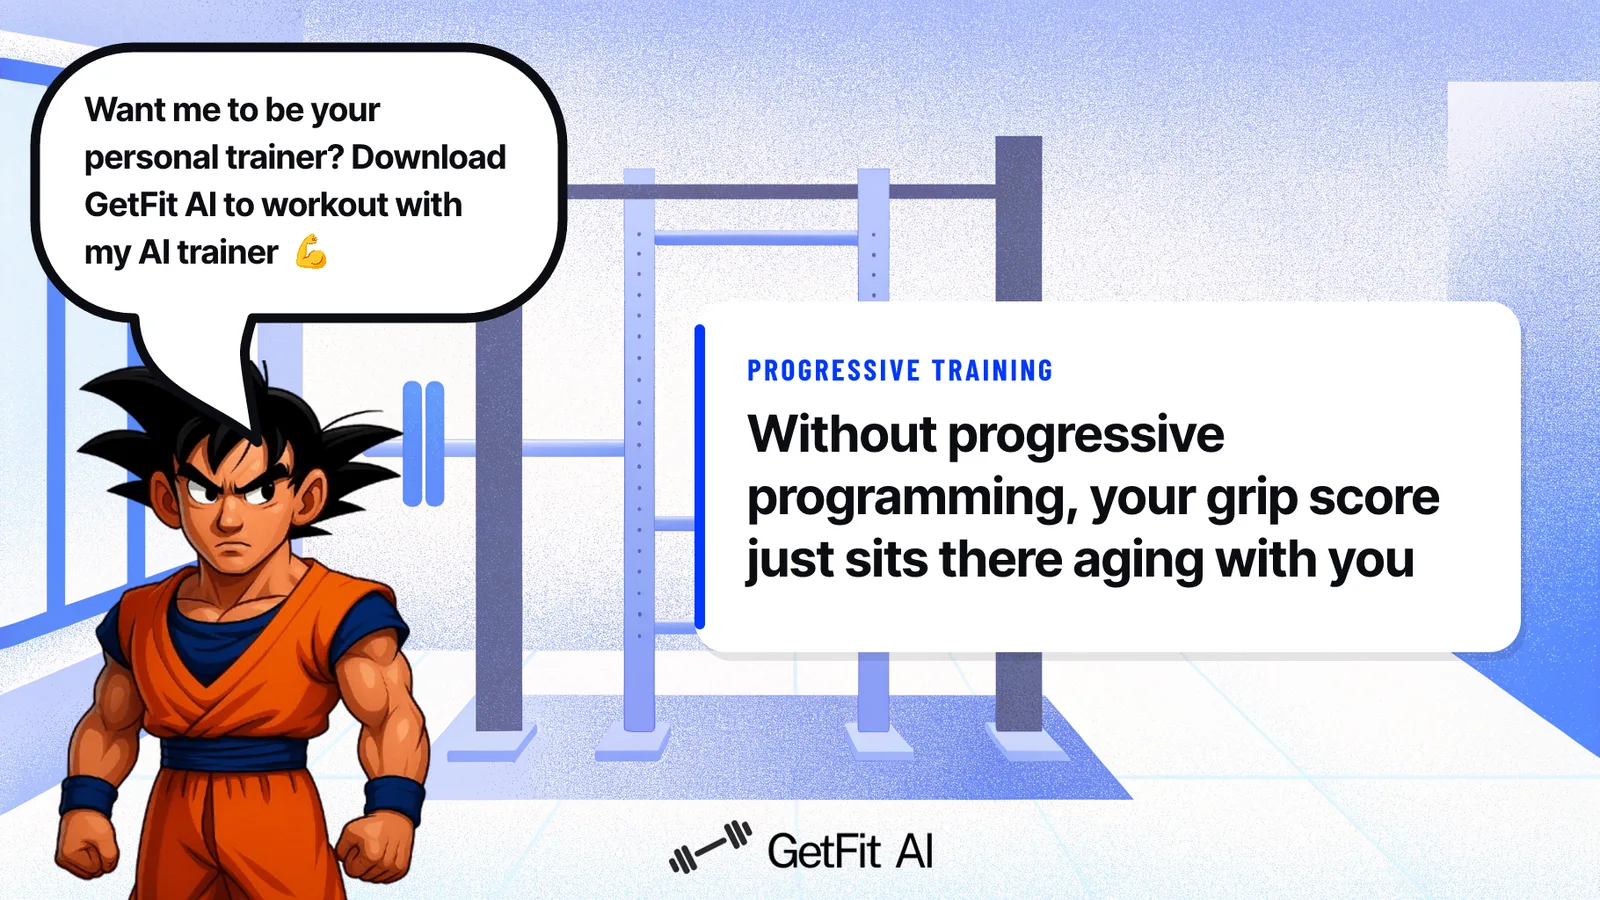
Norms charts are built from population-level data. They tell you how your grip compares to thousands of other people your age and gender. What they cannot tell you is how many sets to do this week, when to add load, or when to back off. That distinction matters more than most people realize. A 42-year-old who tests below average and then adds “some grip work” to an already unstructured routine is not closing the gap. Without a mechanism that adjusts over time, the benchmark just sits there, aging alongside them.
Why Grip Strength Scores Stall Without Progressive Programming
The pattern is almost universal among beginners: test the number, feel motivated, add a few sets of wrist curls or dead hangs, repeat those same sets at the same weight for the next eight weeks, retest, wonder why nothing moved. This is a programming problem. Industry research consistently affirms that structured, periodized training produces measurably superior strength gains compared to unstructured training where load and volume stay fixed. The body adapts to a stimulus and then stops adapting to it. Without a plan that deliberately escalates demand, the training becomes maintenance at best.
One of the most common traps we see beginners fall into is testing their max grip every session without a structured plan to respond to the results. Testing that frequently without programming to match it does not accelerate progress. It accelerates overtraining and impairs recovery, which is precisely the opposite of the intended effect. The score may even drop, which compounds the frustration and is a primary driver of early dropout.
Grip strength is also a silent limiting factor in compound lifts like the deadlift. Trainees hit a wall there and blame their back or their legs, never connecting it to a grip capacity that was never systematically developed, because they had no plan that responded to their grip score in the first place. A plan that adapts to what you actually tested is the thing that closes that gap.
The Age-40 Inflection Point: Grip Programming Must Shift Character, Not Just Intensity
Grip strength declines measurably with each passing decade after age 40, and the rate of loss accelerates after 60. That trajectory means the goal of programming changes. For a 28-year-old, the priority is building peak capacity. For a 45-year-old, the priority shifts toward protecting the joints that make consistent training possible in the first place.
Heavy axle loading gives way to cable work and bodyweight progressions. This is a smarter goal, and it requires a plan that recognizes the difference rather than applying the same template across every age.
GetFit AI builds Athlete-Style Custom Workout Plans calibrated to the individual user, not to an age bracket, and not to a population average, precisely because the right intervention at 45 is structurally different from the right intervention at 28.
Turning Your Grip Score Into a Training Action
Most people handle this by googling a grip exercise, adding it to the end of a workout, and hoping the score improves. The hidden cost is that without a feedback loop, the data decays into noise within weeks. The single most consistent request we hear from beginners navigating this problem is straightforward: give me a plan that adapts instead of one I fall behind on and quit. That is a reasonable ask, and it is the specific problem GetFit AI is built to solve.
GetFit AI’s Structured Training begins from your first workout session and operates during each session and across the overall program arc. After you log a grip measurement, the adaptive programming layer adjusts your upcoming sessions to reflect the new baseline, so the data point you just captured becomes a directive for what you do next rather than a number filed away and forgotten. This is most beneficial for users who have previously struggled with consistency due to a lack of program structure, because the plan moves with them rather than sitting static while they fall behind it.
The social layer compounds this effect. Friends, challenges, and leaderboards are available inside the app, and the experience is most beneficial when at least one friend or workout partner is also using GetFit AI. After connecting with at least one friend in the app, the retention layer activates, the mechanism that keeps users training past week three, which is precisely where unstructured programs lose most of their adherents. For users who want access to all of this, GetFit AI offers a Premium Weekly Subscription at $1.99 per week, a Premium Monthly Subscription at $4.99 per month, and a Premium Yearly Subscription at $49.99 per year.
Related Reading
- Average Deadlift Weight For Male
- Best Calisthenics Workout App
- Best Hiit Workout App
- Best Gym Workout App
- Best Workout Apps
- Best Free Workout Apps
Next steps
If your grip score landed without any indication of what to do next, the path forward starts with connecting that number to a system that actually responds to it. Knowing where you stand on a normative table is step one. Without a training plan that adjusts to your baseline, the benchmark ages alongside you while your strength quietly erodes. Start with our AI fitness app.
The NHANES mortality data makes the stakes concrete: every 5 kg drop in grip strength carries a 16% higher risk of all-cause mortality, meaning a score at the low end of “normal” is not a safe place to stay. And the dropout research is equally direct: the 20% of gym-goers who maintain consistency past 90 days are distinguished not by knowing more numbers, but by having a plan that converts data into daily direction. Those two findings point to the same next step, which is replacing a static score with an adaptive training system that tells you what to do today.
Start with GetFit, which builds your plan from your first session, adjusts as your data changes, and tracks nutrition automatically so your grip score becomes a directive rather than a curiosity sitting on a chart.
Frequently Asked Questions
What is the correct way to test grip strength so my score actually means something?
Sit down, bend your elbow to exactly 90 degrees with your forearm in neutral and your wrist between 0 and 30 degrees of extension, then squeeze the dynamometer for three maximal trials per hand and record the mean. Every normative table is built from scores collected under these exact conditions, so any deviation, wrong posture, arm too straight, only one trial, makes your number incomparable to the population norms.
Do I need to test both hands, or just my dominant hand?
Test and record both hands every time. The dominant hand is typically about 10% stronger than the non-dominant hand, and a gap larger than that can flag a real deficit or early pathology that a single-hand test would miss entirely, which is why clinicians always assess both sides.
What grip strength score puts someone at risk for sarcopenia?
The European Working Group on Sarcopenia in Older People (EWGSOP2, 2019 consensus) sets established clinical screening thresholds for men and women below which a result flags probable sarcopenia and warrants both medical and training attention, for example, a 55-year-old man scoring 24 kg falls below that threshold. Low grip strength in this context is not just a weak result; it is a clinical signal.
How much does a drop in grip strength actually matter for my health?
The effect is dose-response, not a simple threshold, every kilogram lost matters. A 2017 meta-analysis by Wu et al. found that each 5 kg drop in grip strength was linked to a 16% higher risk of all-cause mortality and a 17% higher risk of cardiovascular disease, and a 2024 NHANES analysis by Chai, Zhang, and Fan reported a hazard ratio of 1.16 per 5 kg decrease, confirming the relationship held after controlling for age, sex, and body size.
Can I slow down the grip strength decline that comes with age?
Yes, age and sex are fixed, but protein intake, training consistency, and sleep quality are not. Adequate dietary protein supports muscle protein synthesis, progressive resistance training directly stimulates the neuromuscular adaptations that grip strength reflects, and chronic sleep restriction has been independently associated with accelerated loss of lean mass.