Grip Strength Chart by Age: See How You Compare

Your grip score means nothing without the right benchmark. Here is the age- and gender-normed chart that tells you where you actually stand, and what to do if the number is lower than it should be.
Grip strength varies significantly by age, gender, and which hand is tested. A single universal number tells you almost nothing useful about your own baseline. The common assumption among people who do start paying attention to their physical fitness is that simply showing up consistently is enough, that the chart is just a curiosity, not something that should actually change how they train.
That belief is understandable, but it is also precisely why so many people plateau without ever knowing why. According to a 2011 population-based study published in BMC Research Notes, normative grip data must be stratified by age and gender precisely because averages shift so much across these dimensions. The same study confirmed that the dominant hand typically produces measurably greater force than the non-dominant hand, so the hand you test matters as much as your age bracket.
Most people self-assessing have no idea which threshold applies to them. See our AI fitness app for how this works in practice.
Grip strength is a genuine biomarker for cardiovascular risk and all-cause mortality, and longitudinal research now treats it as such. Strength decline begins earlier than almost anyone expects. Sarcopenia, the gradual loss of skeletal muscle, can begin as early as the third decade of life. By the time the decline is obvious, it has usually been building quietly for years. Researchers and clinicians increasingly use grip strength as an early-warning signal because it reflects overall neuromuscular health before other symptoms appear.
Training without a benchmark produces invisible failure. A 27-year-old who has trained three times a week for six months but has never measured their grip strength has no feedback loop. Without a number tied to an age-normed standard, there is no way to tell whether effort is translating into actual physical adaptation or just consistent attendance.
The frustration of being “stuck at the same weight for months” with no explanation is a data problem. Knowing your number changes the question from “am I trying hard enough?” to a much more answerable and useful one.
Key takeaways
- Grip strength is treated as a clinical vital sign, each 5 kg drop is linked to a 17% higher risk of cardiovascular mortality, according to a 139,691-person Lancet study.
- The same grip score can be perfectly normal or clinically low depending on your age and sex, reading a chart without normative context by gender and decade gives you a useless number.
- The gold standard for measurement is the Jamar hydraulic dynamometer; without consistent protocol, your scores aren't comparable across sessions or to any published reference table.
- EWGSOP2 clinical thresholds, built for diagnosing muscle disease, not just rating athletic performance, define where 'below average' ends and medically significant weakness begins.
- Showing up consistently without a progression mechanism produces maintenance, not growth; the body stops adapting to the same stimulus after roughly six weeks.
- A grip score is a starting line, not a destination, acting on it requires a plan that applies progressive overload and adjusts as your capacity changes.
- GetFit AI closes that gap by building a custom, adaptive workout plan in your favorite athlete's training style, with an AI trainer available anytime to adjust the plan as your grip, and the rest of your fitness, actually progresses.
Grip Strength Chart by Age and Gender: Where the Population Peaks and Falls
A number without context is just noise. The same 70-pound grip reading that flags as clinically low for a 30-year-old man sits comfortably within normal range for a 75-year-old woman, same digit, opposite ends of the population distribution. Understanding where your score actually lands requires two things: a solid normative reference table and the honesty to account for your age, sex, and which hand you tested.
Normative Grip Strength by Age and Gender: The Full Reference Table
Mathiowetz et al., published in the Archives of Physical Medicine and Rehabilitation in 1985, remains the most widely cited clinical benchmark for adult grip strength norms. The study tested 310 men and 328 women aged 20 to 94 using a calibrated dynamometer, producing the age- and sex-segmented reference values that clinicians still use today. The NIH Toolbox normative project (industry data) later corroborated these figures across 1,232 community-dwelling adults aged 18 to 85.
| Age Group | Men (avg lbs) | Women (avg lbs) |
|---|---|---|
| 20-29 | 106 | 62 |
| 30-39 | 110 | 66 |
| 40-49 | 102 | 60 |
| 50-54 | 100 | 57 |
| 60-69 | 88 | 51 |
| 70-75+ | 75 | 44 |
Men Peak Near 110 lbs, Women Near 66 lbs, and Both Curves Fall Faster Than Most Expect After 40
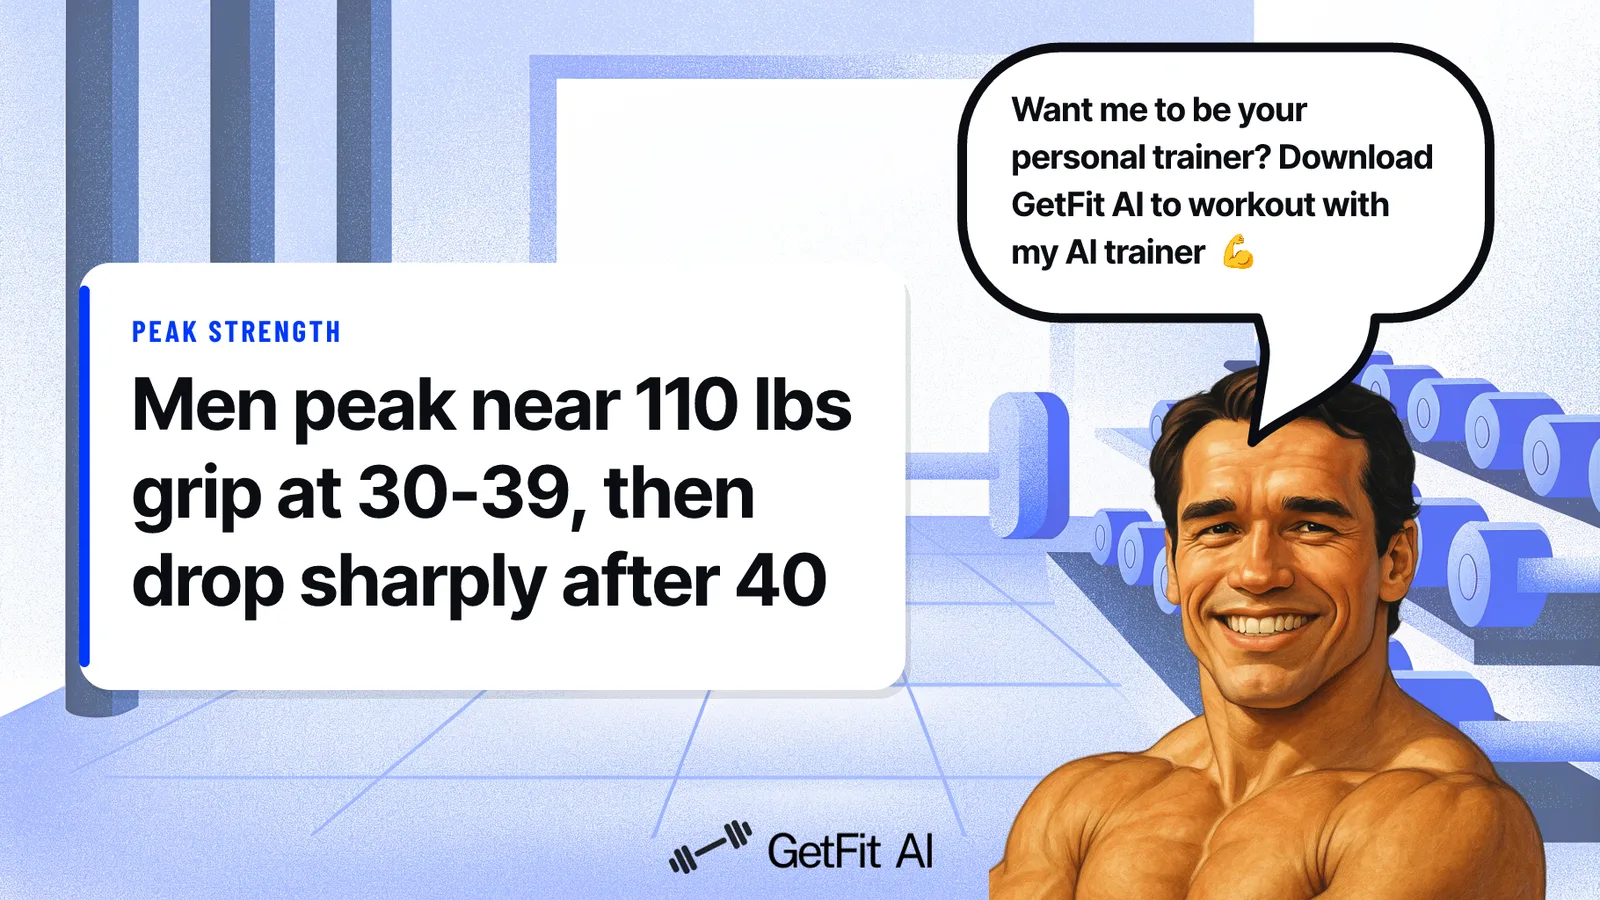
Peak grip strength occurs between ages 25 and 39 for both sexes, with men and women both reaching their highest average readings during this window before a progressive decline begins. After 40, the decline is not a gentle slope. Longitudinal cohort data consistently shows meaningful losses per decade, so a man who peaks in his mid-thirties can find himself significantly weaker by his late 50s without deliberate training intervention. That drop is large enough to shift someone from an above-average percentile to a well-below-average one in a single decade.
Dominant vs. Nondominant Hand: Why Your Weaker Side Should Be Within 10% of Your Stronger One
Mathiowetz et al. identified functional laterality as a key variable in normative comparisons. Research consistently places the expected dominant-to-nondominant deficit within a narrow range, with some studies extending the acceptable gap further in strongly right-handed individuals. A gap beyond that range can signal asymmetric loading patterns or an unaddressed weakness on one side. A lifter who scores average on each hand in isolation could still be running a problematic asymmetry if their gap sits outside the expected window, something no single reference table combines into one actionable view.
Related Reading
- Best Fitness Apps
- How Many Pull Ups Should I Be Able To Do
- Average Grip Strength Male
- Average Bench Press
- How Much Does A Bench Press Bar Weigh
- Average Male Bench Press
- How Much Can The Average Man Bench Press
- Symmetric Strength
- Bench Press Standards
How to Measure Grip Strength Correctly: So Your Number Actually Means Something
A grip strength number is only useful if it was produced the same way the reference charts were built. This section covers the gold-standard device researchers and clinicians measure against, the exact four-step protocol that makes your result comparable to published norms, and how small deviations in posture or elbow angle can shift your percentile by enough to matter.

The Jamar Hydraulic Dynamometer, the Gold Standard
Grip strength measurement has a reference point every researcher and clinician works from: the Jamar hydraulic hand dynamometer. According to Santos et al. (2025) from the University of São Paulo, the Jamar hydraulic hand dynamometer is the instrument against which all alternative devices, including the Jamar Plus+ and Biodex systems, are validated. A separate August 2025 preprint from JSS College of Physiotherapy (Francis, Kalashree and Joseph) confirms that hydraulic dynamometers like the Jamar hold superior reliability and precision over other device types. That consistency is what makes chart comparisons meaningful in the first place.
The Clinical Protocol in Full
How to measure grip strength correctly comes down to four non-negotiable steps:
-
Sit down.
-
Bend your elbow to exactly 90 degrees.
-
Squeeze three times per hand with adequate rest between attempts.
-
Record either the best or the mean value.
Santos et al. (2025) spell this out directly, noting that results are only comparable to published normative data when this exact sequence is followed. Skip one step and you are no longer measuring the same thing the chart was built from.
How Small Deviations Shift Your Percentile
Testing grip while standing with your arm fully extended versus seated at 90 degrees can produce readings that are meaningfully apart, which is enough to move you from average to below average on a normative chart. Santos et al. are explicit: small deviations in arm position, rest interval, or device type can shift a reading enough to alter percentile ranking entirely. An apparent improvement or plateau over weeks could be pure measurement noise, not a real signal of neuromuscular change.
Hidden Variables That Move Your Reading Before You Squeeze
Time of day, fatigue, recent training load, and hand dominance all shift grip readings in measurable ways. Dominant hands typically read higher than non-dominant hands on normative tables, so testing the wrong hand and comparing it to the wrong column produces a misleading result. For anyone tracking progress over months, the practical fix is simple: use the same device on every occasion, at the same time of day, with the same rest intervals, and always test both hands in the same order. That consistency is what separates a number that changed from one that only appears to have.
What Counts as Weak Grip Strength, and the Clinical Thresholds You Shouldn’t Ignore
Not all grip strength numbers carry the same weight. Some values place you below your peers on a population chart; others cross clinical thresholds that researchers and physicians use to identify probable sarcopenia and flag the need for intervention. Understanding which category your score falls into changes what you should actually do about it.
Your grip strength score sits inside a clinical framework most people have never heard of, built not for athletes but for doctors screening patients for muscle disease. Understanding where that framework draws its lines changes what a low score actually means for you.
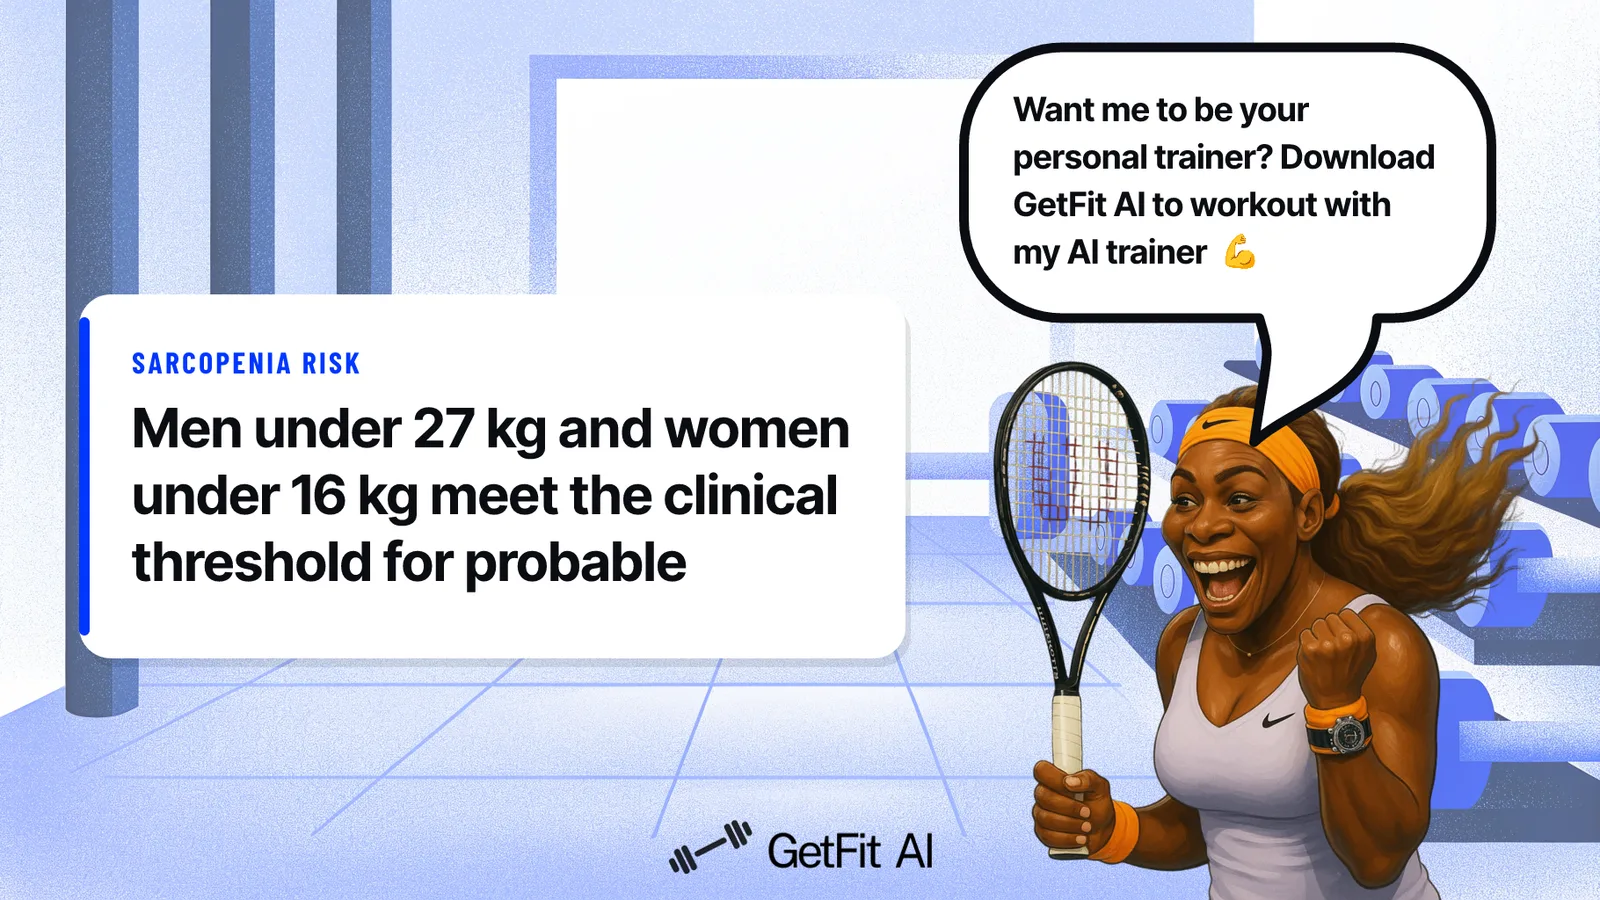
The EWGSOP2 Cutoffs: Under 27 kg for Men, Under 16 kg for Women
Grip strength values below 27 kg for men and below 16 kg for women indicate low muscle strength consistent with probable sarcopenia, according to the European Working Group on Sarcopenia in Older People 2 (EWGSOP2, Age and Ageing, 2018). These are consensus thresholds, validated across large populations, used by clinicians to flag patients who need intervention. The clinical evidence does not support the common assumption that grip strength charts are a curiosity, that consistent training will eventually produce results regardless, and that no number on a reference table should meaningfully change how someone approaches their programming.
Consider what that means in practice. A 29-year-old man testing at 25 kg sits below this cutoff despite being in what should be his peak strength years. He can hold a barbell, open a jar, carry groceries. The threshold does not care how things feel. It measures what the muscle is actually producing.
Why “Below Population Average” and “Below Clinical Threshold” Are Two Different Alarms
These are separate warnings, and conflating them costs you information. The two signals measure fundamentally different things:
-
Below population average, your grip is weaker than most peers your age, a relative, rank-based signal.
-
Below the EWGSOP2 cutoff, an absolute signal tied to elevated risk of falls, fractures, physical disability, and mortality, as the same 2018 consensus document makes clear.
Population percentile tells you where you rank. The clinical cutoff tells you whether your muscle output has dropped into territory associated with serious downstream health risk. Both situations call for action, but for different reasons.
What Sarcopenia Screening Means Outside a Clinical Setting
Sarcopenia is typically framed as a condition affecting people in their sixties and seventies. That framing is misleading. The EWGSOP2 repositioned low muscle strength, detected via grip, as the primary indicator of sarcopenia, replacing low muscle mass as the defining criterion. The cutoffs apply regardless of age. A 29-year-old below the EWGSOP2 threshold is flagged by the same clinical criteria used for a 70-year-old, because the threshold reflects what the muscle is actually producing, not how old the person producing it is.
Related Reading
- Do Pull Ups Work Chest
- Grip Strength Norms
- Average Deadlift Weight
- 1 Rep Max Chart
- Average Male Deadlift
- Good Bench Press Weight
- Weightlifting Standards
- Average Bench Press Kg By Age
- Average Deadlift Weight Kg
Grip Strength and Longevity: What Your Score Predicts Beyond the Gym
Most people treat grip strength as a gym metric, something that determines whether you can hold a heavier deadlift or finish a pull-up set. But the same number on your grip strength chart predicts cardiovascular mortality, stroke risk, and all-cause mortality with an accuracy that rivals clinical measures your doctor already takes seriously. Understanding what your score signals beyond athletic performance is where that data becomes actionable.
The Cardiovascular Connection
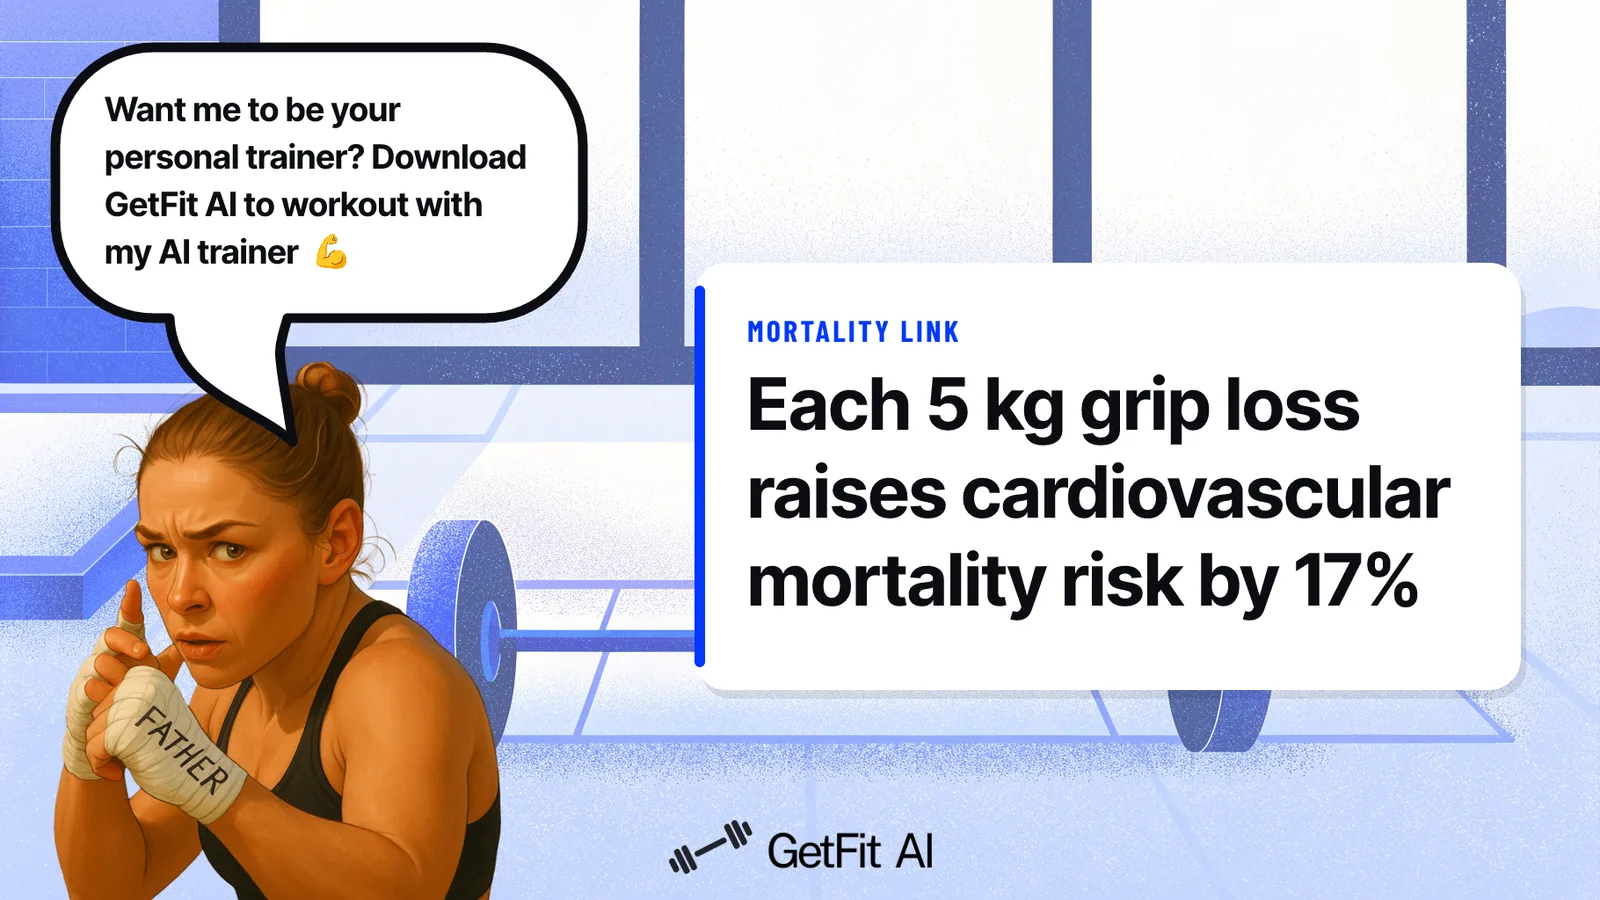
The Prospective Urban Rural Epidemiology (PURE) study-6/abstract), published in The Lancet, followed 139,691 participants across 17 countries and found that each 5 kg drop in grip strength was associated with elevated mortality and cardiovascular risk across the board:
-
17% higher risk of cardiovascular mortality
-
17% higher risk of non-cardiovascular mortality
-
16% higher risk of all-cause mortality
-
9% higher stroke risk
-
7% higher myocardial infarction risk
That relationship held after adjusting for age, sex, physical activity, BMI, tobacco use, and other cardiovascular risk factors. Grip strength was actually a stronger predictor of cardiovascular mortality than systolic blood pressure in the same dataset.
Grip strength was actually a stronger predictor of cardiovascular mortality than systolic blood pressure in the same dataset.
Key takeaway: Grip strength predicted cardiovascular mortality independently, not as a proxy for people who exercise more, which is precisely what separates a genuine biomarker from a lifestyle confound.
One challenge that comes with this territory: people who prioritize grip and pulling strength often face quiet skepticism about whether that kind of training has any real-world value beyond the gym floor. The PURE study answers that skepticism definitively. Grip strength predicts cardiovascular mortality independently, because it is epidemiologically documented across nearly 140,000 people in 17 countries rather than tagging people who happen to live healthier lives in other ways. That matters for anyone who has ever been told their grip-focused training is a curiosity rather than a health investment.
This is also where structured, consistent training becomes the lever that moves the number. Beginners who have previously struggled with consistency due to lack of program structure rarely fail from effort; they fail because they walk into a gym without knowing which exercises to do, how many sets to perform, or in what order. That uncertainty compounds: one skipped session becomes a skipped week, and the adaptation signal the body needs never accumulates.
GetFit’s Structured Training addresses this from the first workout session, delivering athlete-style custom workout plans that tell you exactly what to do today, which exercises, how many sets, in what order, so the decision cost of showing up is effectively zero. If the gym is packed and a station is taken, you can swap an exercise on the fly without losing the session’s structure or intent.
Grip Strength and Brain Health
Low grip strength predicts higher cognitive decline risk, a finding that surprises most people the first time they encounter it. Longitudinal cohort research has consistently shown that weaker hand force in midlife correlates with faster cognitive deterioration and elevated dementia risk in later decades. The mechanism is not purely associative: grip strength reflects the integrity of the central nervous system’s motor pathways, and deterioration in those pathways often precedes detectable cognitive symptoms. In other words, the hand is sending a signal from the brain long before other tests catch the change.
Grip as a Proxy for Muscle Mass and Neuromuscular Efficiency
Clinically, grip strength is used as a front-line proxy for total skeletal muscle mass, which is why the European Working Group on Sarcopenia in Older People uses it as a primary screening criterion. The correlation exists because skeletal muscle throughout the body tends to decline in parallel; the forearm is the most accessible measurement point. A weak grip rarely sits in isolation; it typically reflects reduced neuromuscular efficiency and lower lean mass across the whole system.
This is the detail that reframes the PURE study data most sharply. The EWGSOP2 clinical thresholds, below 27 kg for men and below 16 kg for women, exist to flag probable sarcopenia and its downstream risks of falls, fractures, and mortality. But the PURE study makes the stakes concrete: those cardiovascular and mortality risks begin accumulating well before a person feels weak or looks it. The grip number is the early signal. The clinical threshold is where that signal turns into a warning.
Moving that number requires more than a single good week in the gym. It requires sustained neuromuscular load applied across weeks and months, which is where most beginners stall. GetFit’s structured training arc is designed to deliver guidance continuously, across each individual workout session and across the broader program arc, with friends, challenges, and leaderboards providing the social accountability layer that keeps users training past week three. The retention effect is strongest once a user has connected with at least one friend in the app, at which point the program shifts from a solo discipline exercise into a shared commitment, the kind of environment where grip strength improvements compound into the long-term adaptations the PURE data rewards.
Why Your Grip Strength Stays Stuck, and How a Structured Plan Changes the Number
Showing up consistently and still watching your grip strength flatline is one of the most demoralizing experiences in training. The effort is real. The hours are real. But effort without a progression mechanism is just maintenance, and maintenance is not the same as growth.
“Lifters plateau in upper body strength without realizing weak grip is a hidden limiting factor. Before I was an average gym bro progressing at an average rate, often plateauing.”
— what we hear from gym-goers and weightlifters
The Plateau Mechanism
The body adapts to a training stimulus quickly, then stops. According to Plotkin et al. (2022) in PeerJ, progressive overload is the foundational principle of resistance training design: without systematically increasing neuromuscular demand, the training stimulus remains constant and further muscular adaptations plateau. In plain terms, the farmer’s carry that challenged your forearms in week two becomes a warm-up by week six. The weight hasn’t changed. Neither has your grip.
There is a second problem that compounds the first. Grip readings are acutely suppressed by fatigue, poor sleep, and time-of-day effects. A lifter who is genuinely stalling will produce numbers that look like normal day-to-day variation rather than a true plateau, masking months of wasted effort. Only consistent testing under controlled conditions, tracked across weeks, reveals whether a flat number is measurement noise or a real signal that the stimulus needs to change.
Progressive Overload: The Missing Variable
The same Plotkin et al. research confirms that both load progression and repetition progression drive continued adaptation. The critical word is structured: some form of measurable progression must be present, or the body has no new demand to accommodate. Most grip training advice stops at exercise selection. It tells you to do dead hangs and plate pinches, but never tells you when to add load, when to add time, or when to swap the movement entirely.
This is the frustration that surfaces among lifters who have been training grip for months without results. The root cause, in most cases documented in progressive overload research, is the absence of a structured feedback loop that tells the athlete when and how to increase demand.
What the Research Reveals About Grip Gains in Adults Over 40
Adults over 40 face a compounding headwind. Skeletal muscle strength declines progressively after age 30, with the rate accelerating notably after 60, according to sarcopenia research in the clinical literature. That means a 42-year-old doing the same three cable exercises every session for 12 weeks is fighting biology with a static stimulus, and losing.
Key takeaway: The decline does not pause while the program stays the same. Only a plan that deliberately escalates demand week over week gives the neuromuscular system a reason to adapt rather than simply maintain.
Related Reading
- Average Deadlift Weight For Male
- Best Calisthenics Workout App
- Best Hiit Workout App
- Best Gym Workout App
- Best Workout Apps
- Best Free Workout Apps
Next steps
If your grip number has been sitting flat for months despite consistent training, the path forward starts with recognizing that effort without a measurable progression mechanism is not training. It is maintenance. And maintenance, as the progressive overload research confirms, produces no new neuromuscular adaptation once the body has accommodated the stimulus. Start with our AI fitness app.
The PURE study finding that each 5 kg drop in grip strength carries a 16 to 17 percent shift in cardiovascular and all-cause mortality risk means your score is not a gym metric. It is a health gradient, and every month it stagnates is a month that gradient does not move in your favor. The Plotkin et al.
Progressive overload research means that stagnation is almost never an effort problem. It is a structure problem, specifically the absence of a deliberate, tracked week-over-week increase in either load or reps. Together, those two findings point to one logical next step: pair your grip score with a plan that is built to move it, not just repeat it.
Start with GetFit to get an athlete-style custom plan that builds progressive overload in from week one, so your grip number has somewhere to go beyond the chart.
Frequently Asked Questions
At what age does grip strength start to decline?
Peak grip strength occurs between ages 25 and 39 for both men and women, after which a progressive decline begins. After 40, the drop is not a gentle slope, longitudinal cohort data shows meaningful losses per decade, enough to shift someone from an above-average percentile to a well-below-average one within a single decade.
What are the clinical cutoffs that flag dangerously low grip strength?
The European Working Group on Sarcopenia in Older People 2 (EWGSOP2) sets the thresholds at under 27 kg for men and under 16 kg for women as indicative of low muscle strength consistent with probable sarcopenia. These are consensus cutoffs validated across large populations and used by clinicians to flag patients who need intervention, they apply regardless of age, meaning a 29-year-old below the threshold is flagged by the same criteria as a 70-year-old.
How big a difference between my right and left hand grip is normal?
Research places the acceptable dominant-to-nondominant deficit within a narrow range, with some studies extending the gap slightly further in strongly right-handed individuals. A gap beyond that range can signal asymmetric loading patterns or an unaddressed weakness on one side, something a single reference table won’t catch on its own.
Does grip strength actually predict anything beyond how strong my hands are?
Yes, the PURE study, which followed 139,691 participants across 17 countries, found that each 5 kg drop in grip strength was associated with a 17% higher risk of cardiovascular mortality, 16% higher risk of all-cause mortality, and elevated stroke and heart attack risk, even after adjusting for age, sex, BMI, and physical activity. Grip strength was actually a stronger predictor of cardiovascular mortality than systolic blood pressure in the same dataset, and longitudinal research also links weaker grip in midlife to faster cognitive decline and elevated dementia risk.
Does it matter how I measure my grip strength, or is any squeeze test good enough?
The measurement protocol matters a great deal, results are only comparable to published normative data when you sit down, bend your elbow to exactly 90 degrees, squeeze three times per hand with adequate rest between attempts, and use a calibrated hydraulic dynamometer like the Jamar. Testing while standing with your arm fully extended versus seated at 90 degrees can produce readings that are meaningfully different, enough to move you from average to below average on a normative chart entirely from measurement error alone.